
Instructions on adding an annotation or note onto a chart
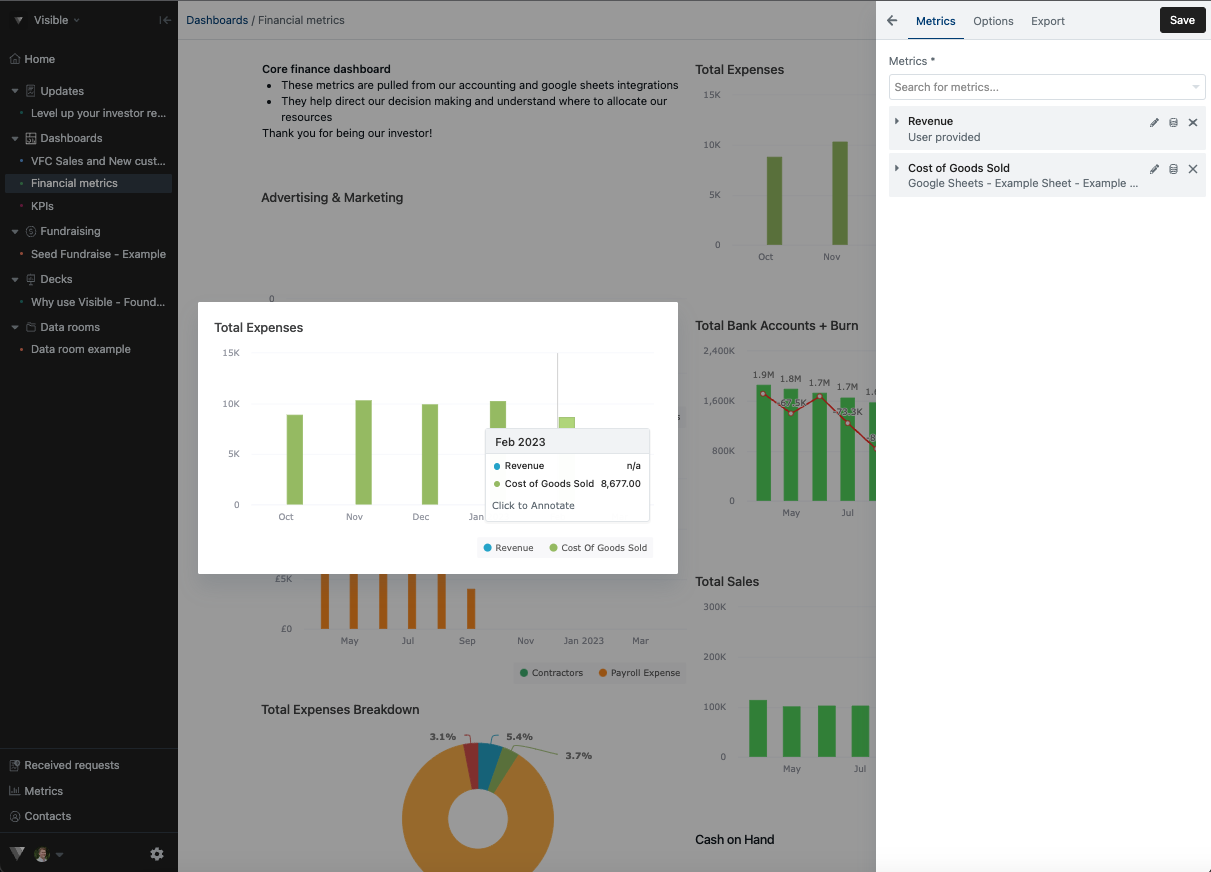
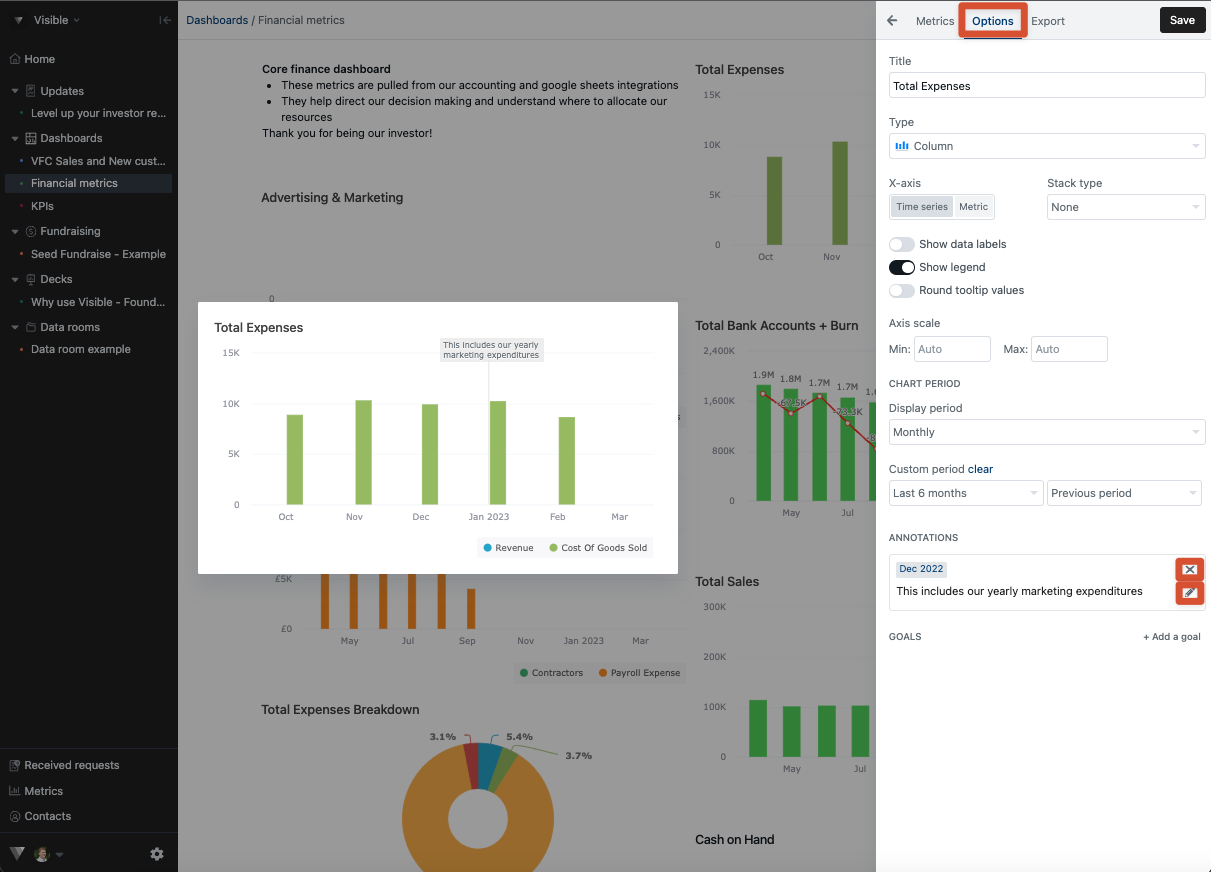
To add an annotation or comment to a chart you will want to start in the chart editor by clicking the three dots in the top right of your chart and choosing Edit. From here, you will see your chart displayed in the center of the screen. You will need to hover over any specific data point on the chart that would like to annotate.
When hovering over a data point, you will see Click to Annotate appear in the tool tip. Simply click the specific data point where you'd like to add an annotation and a text box will display where you can add up to a 100 characters. Click Save, and you will be on your way!
See screenshots of the process below:
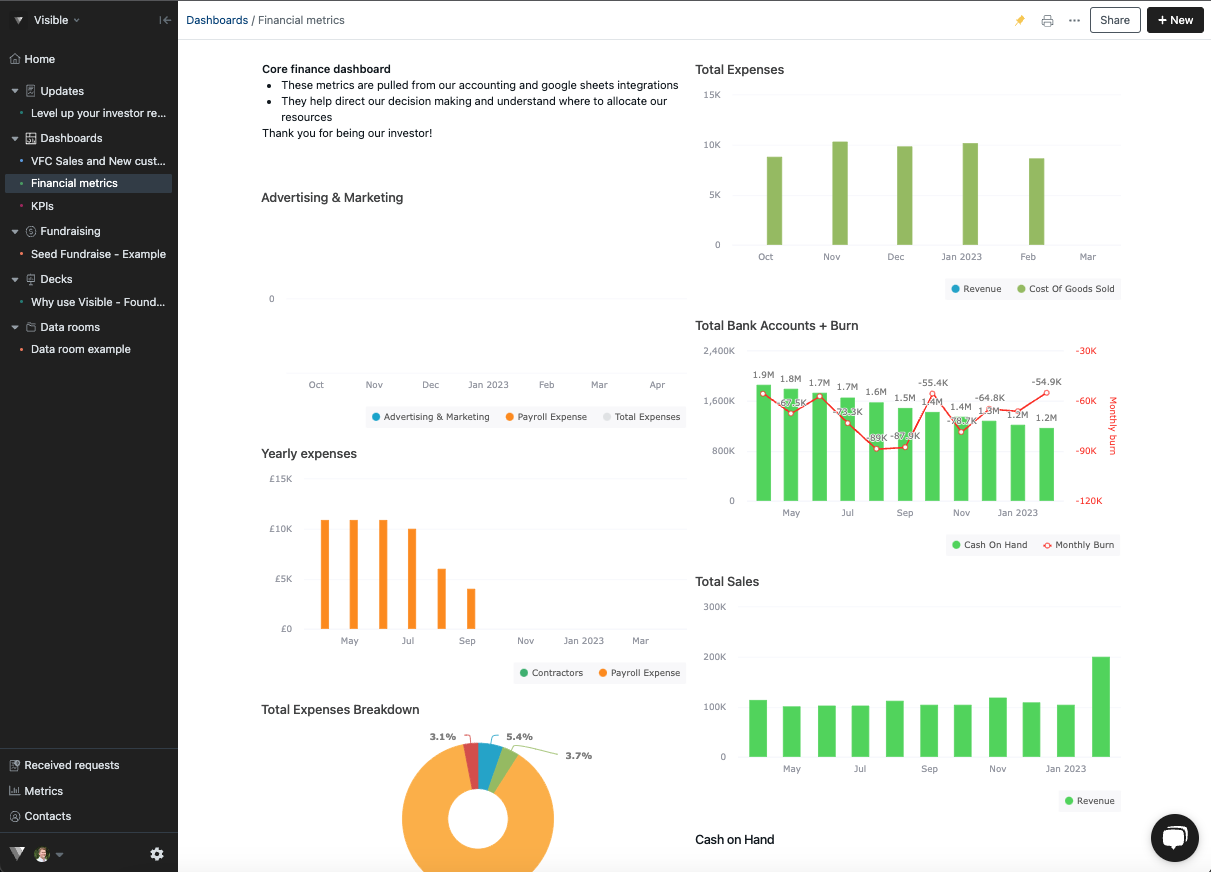
Open your dashboard
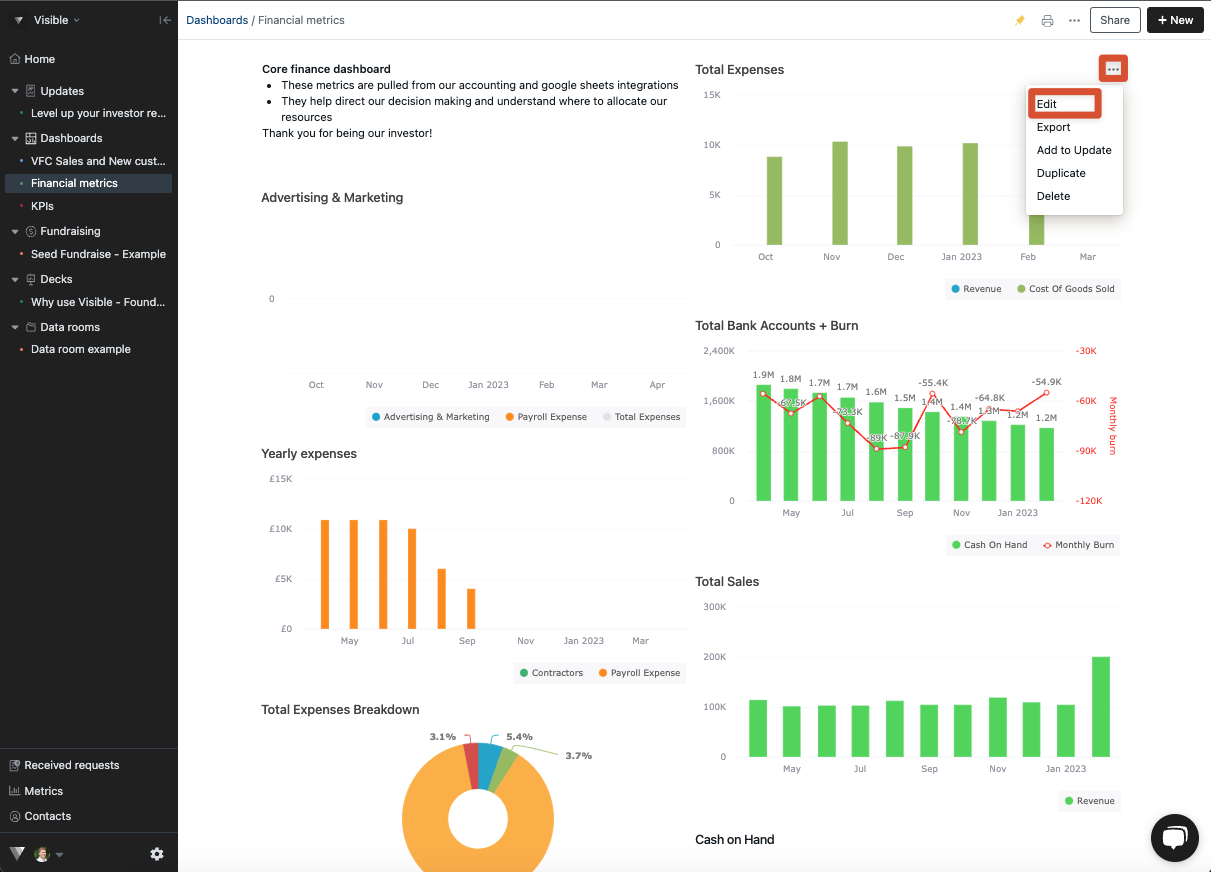
Click on the three dots in the top right of your chart then Edit
Hover over a data point with your cursor
Type out your annotation and click Add to create your annotation
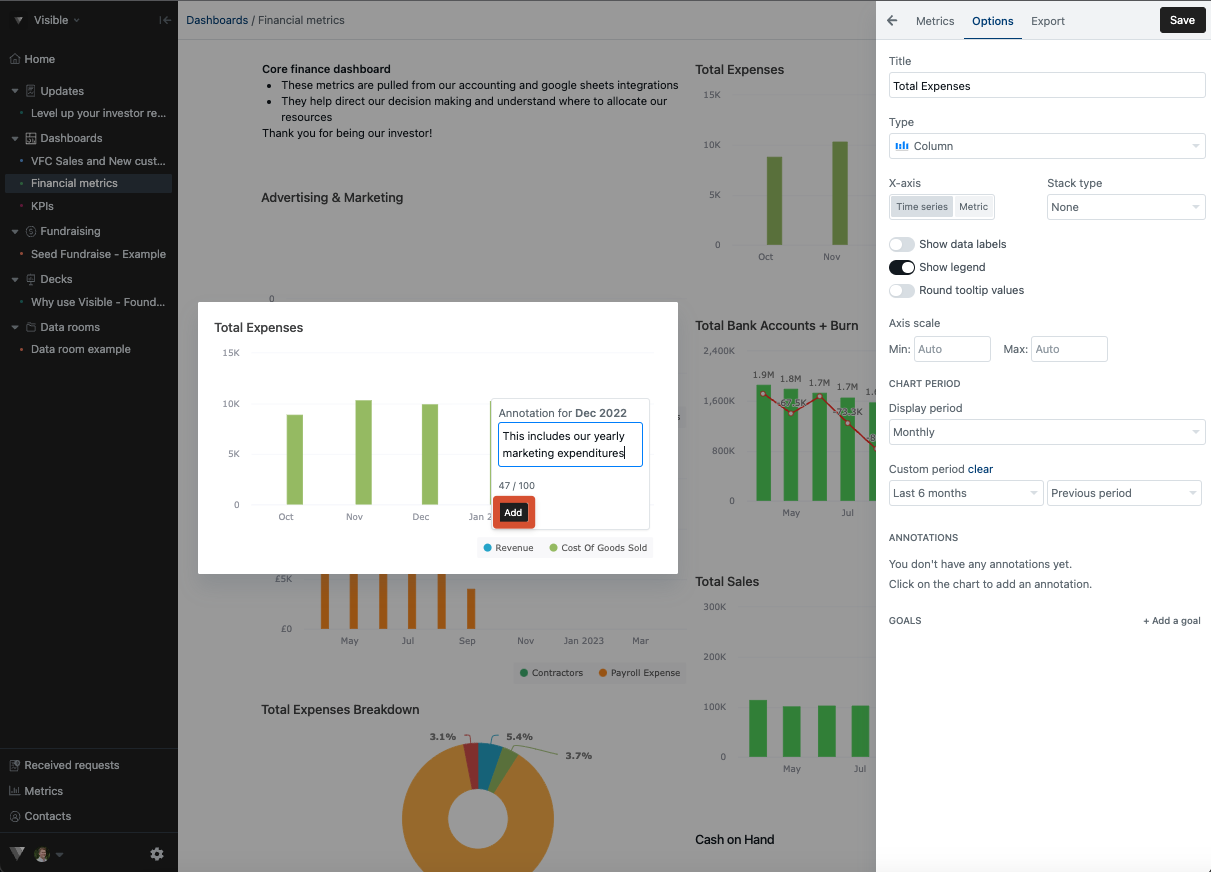
If you would like to edit or delete your chart annotation, go into Options in your chart builder and click the 'x' or 'check mark' under Annotations
Please let us know if you have any additional questions when building charts or dashboards