
Instructions on adding content (charts and graphs) to your update.
To add a chart to your Update, you will want to open Visible. Click into Updates along the left side of your screen and open the update where you wish to add the chart. When constructing the draft you will see options to add content options after clicking the + button. You will want to choose Chart. Click on Edit chart and this will open the chart builder. You can either bring in an existing chart from your dashboard or create new ones. You can either add an existing chart or build a new chart directly on your update draft.
Check out this article on how to create a chart as well.
See screenshots below for a step by step process
Open Visible

Click on Updates along the left side of your screen
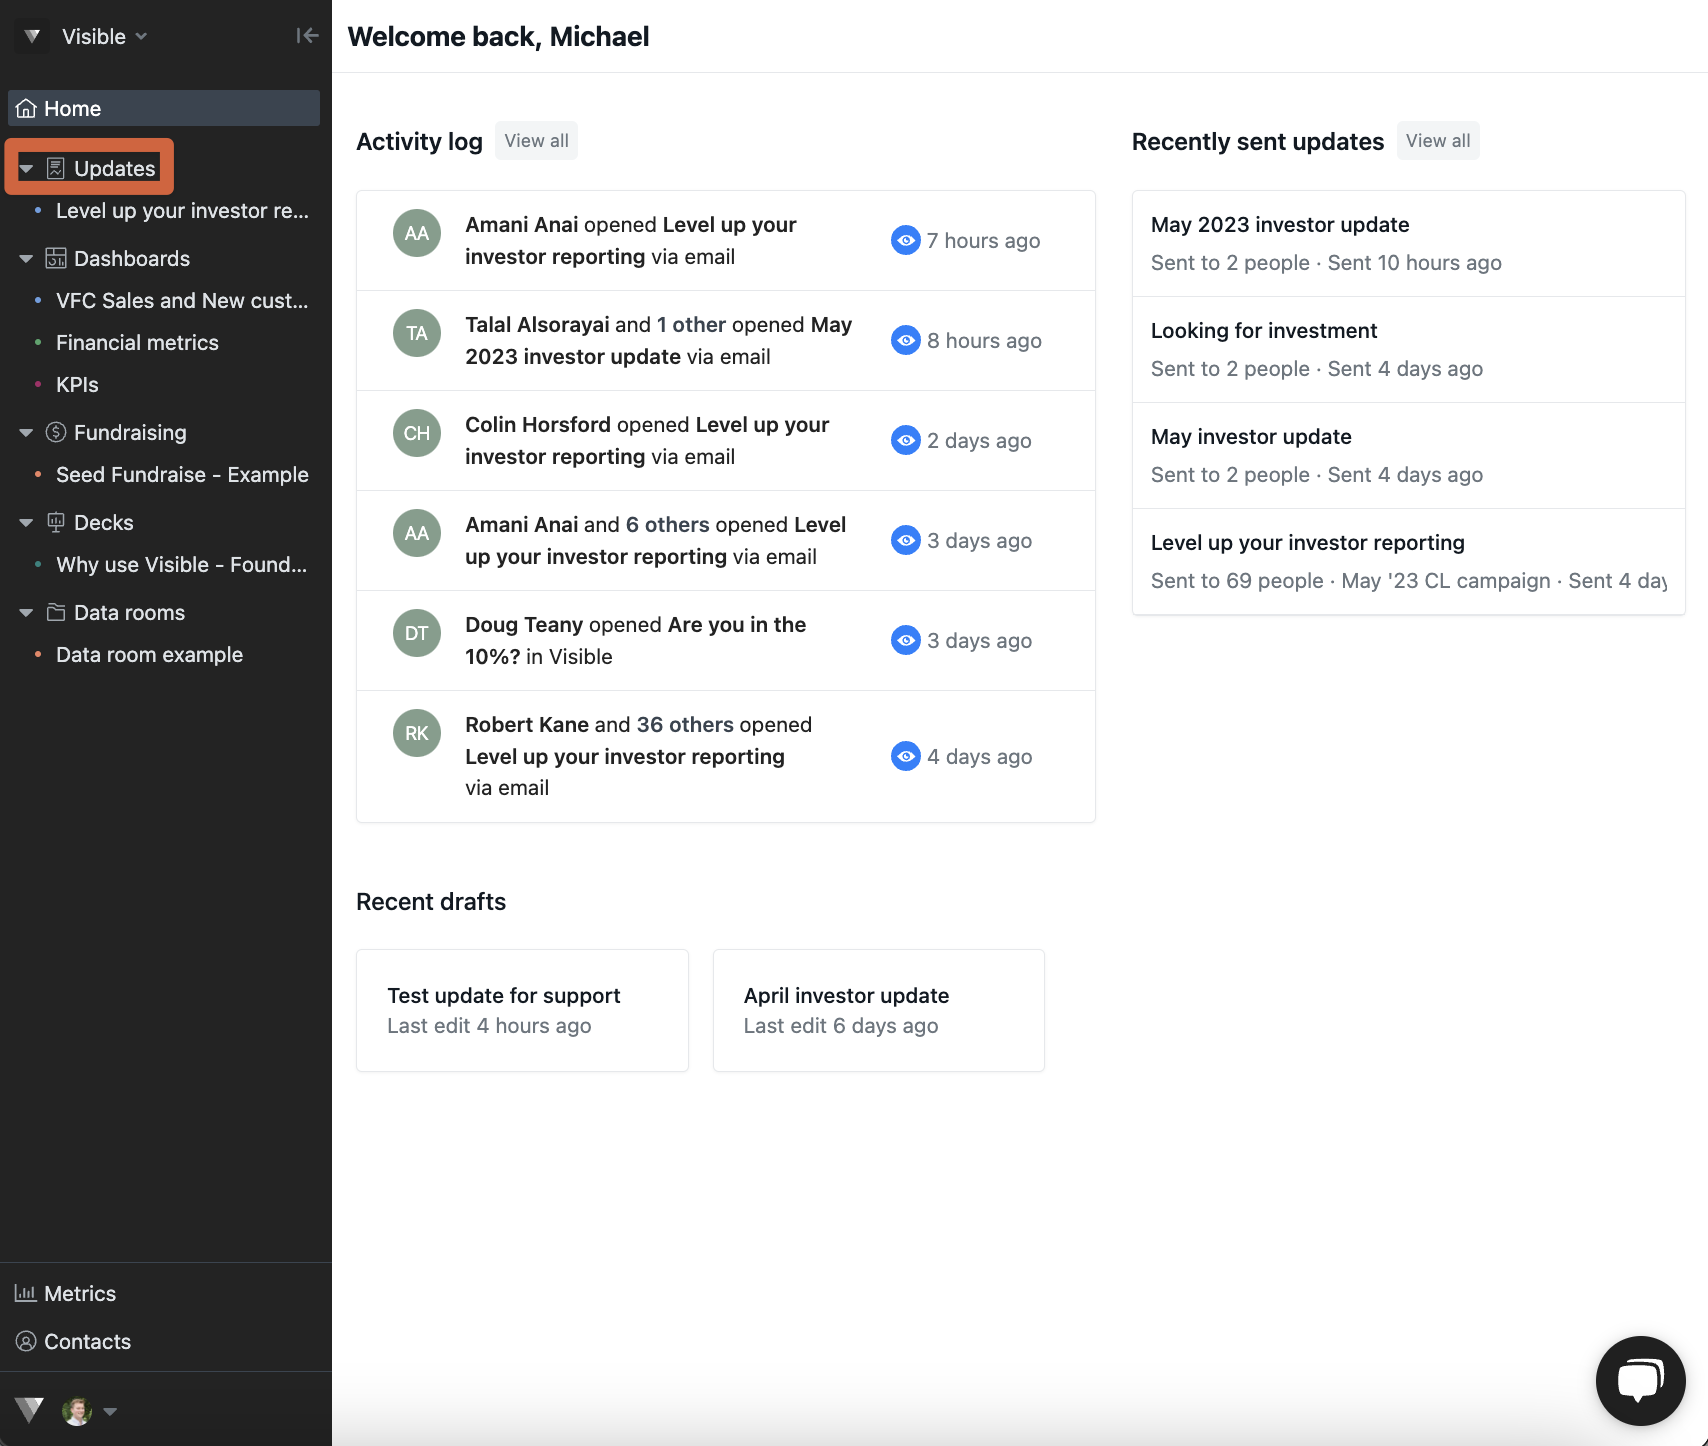
Open the update you wish to add two charts to
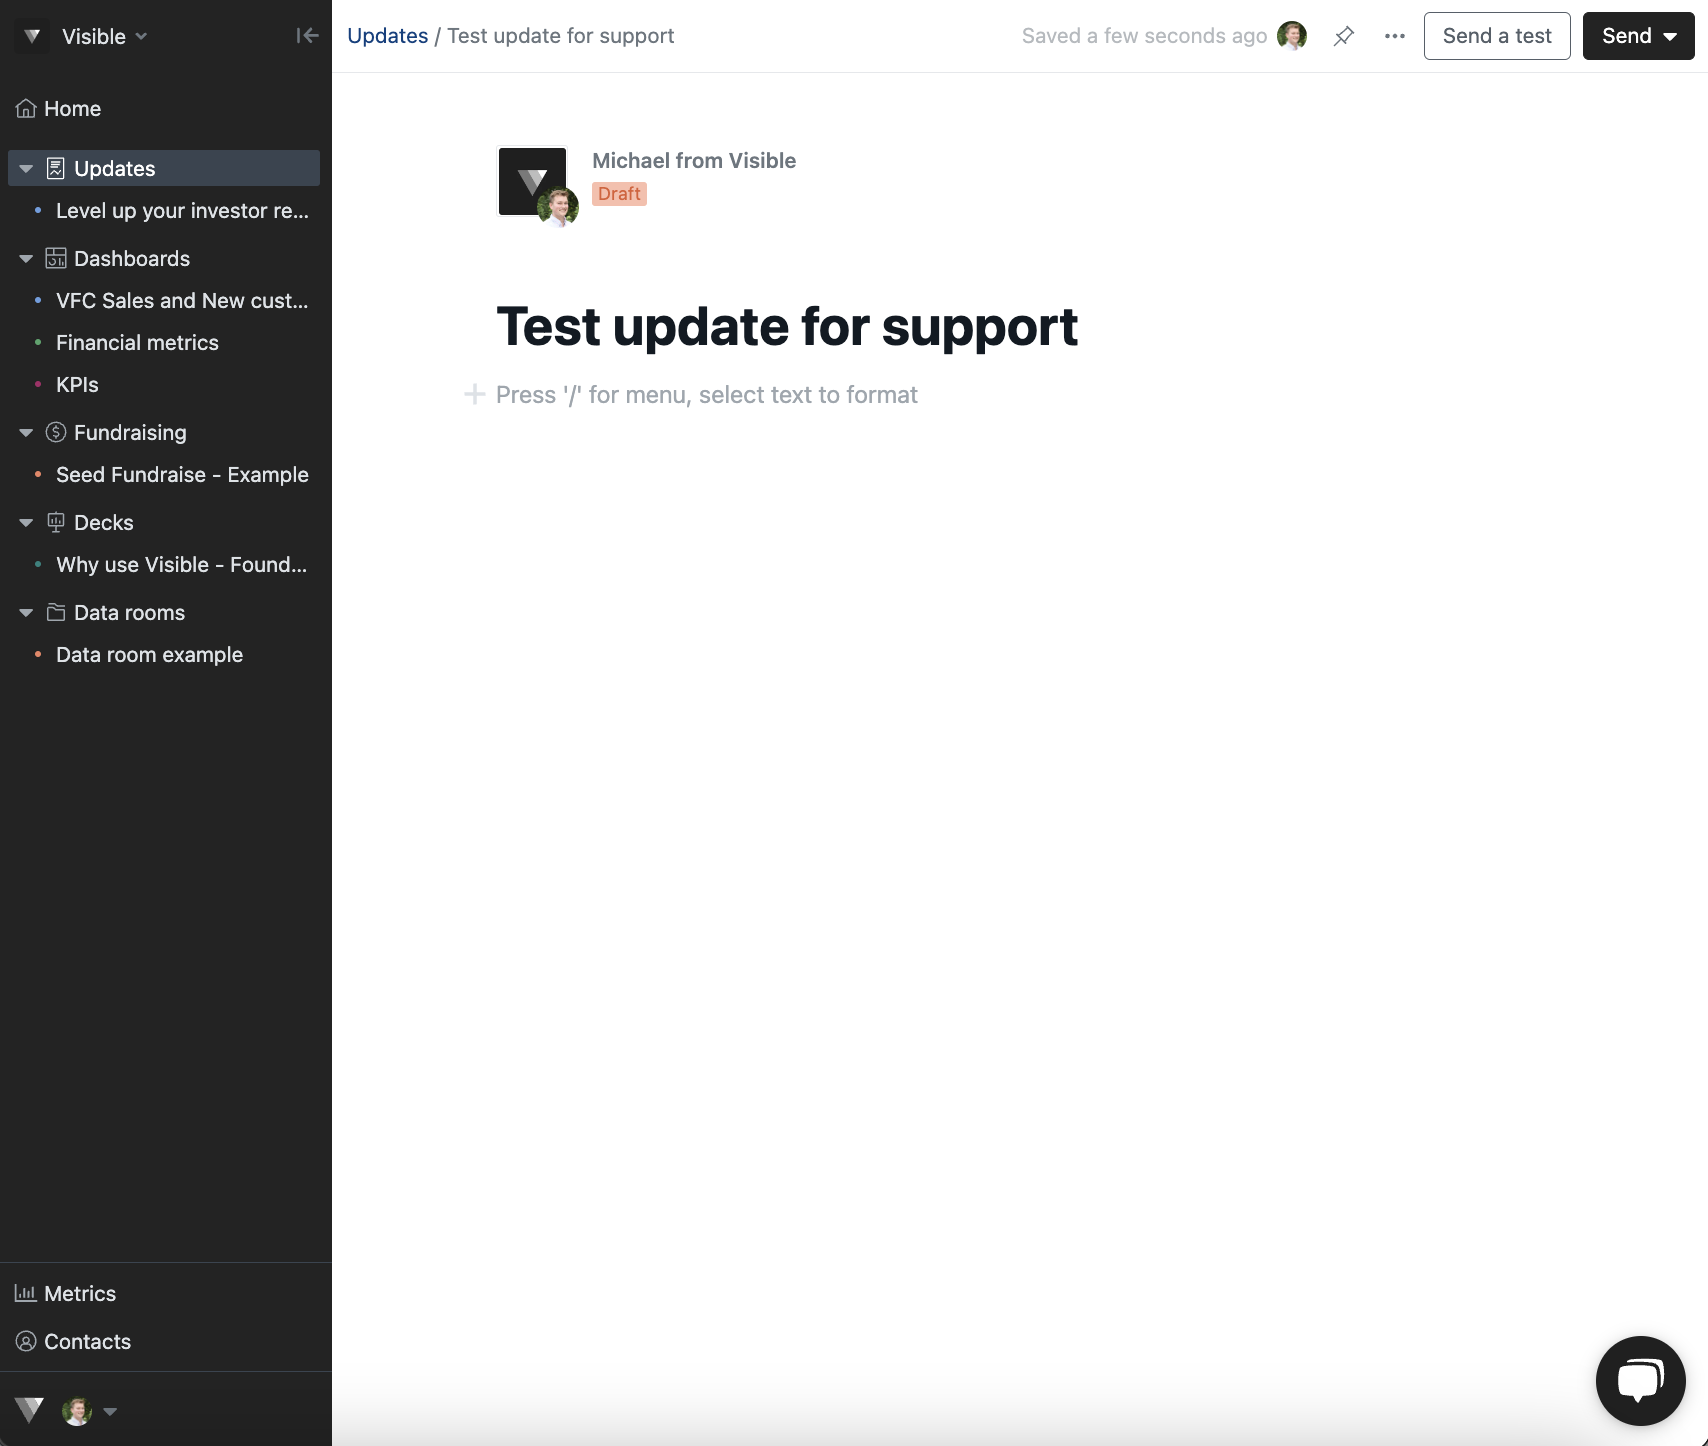
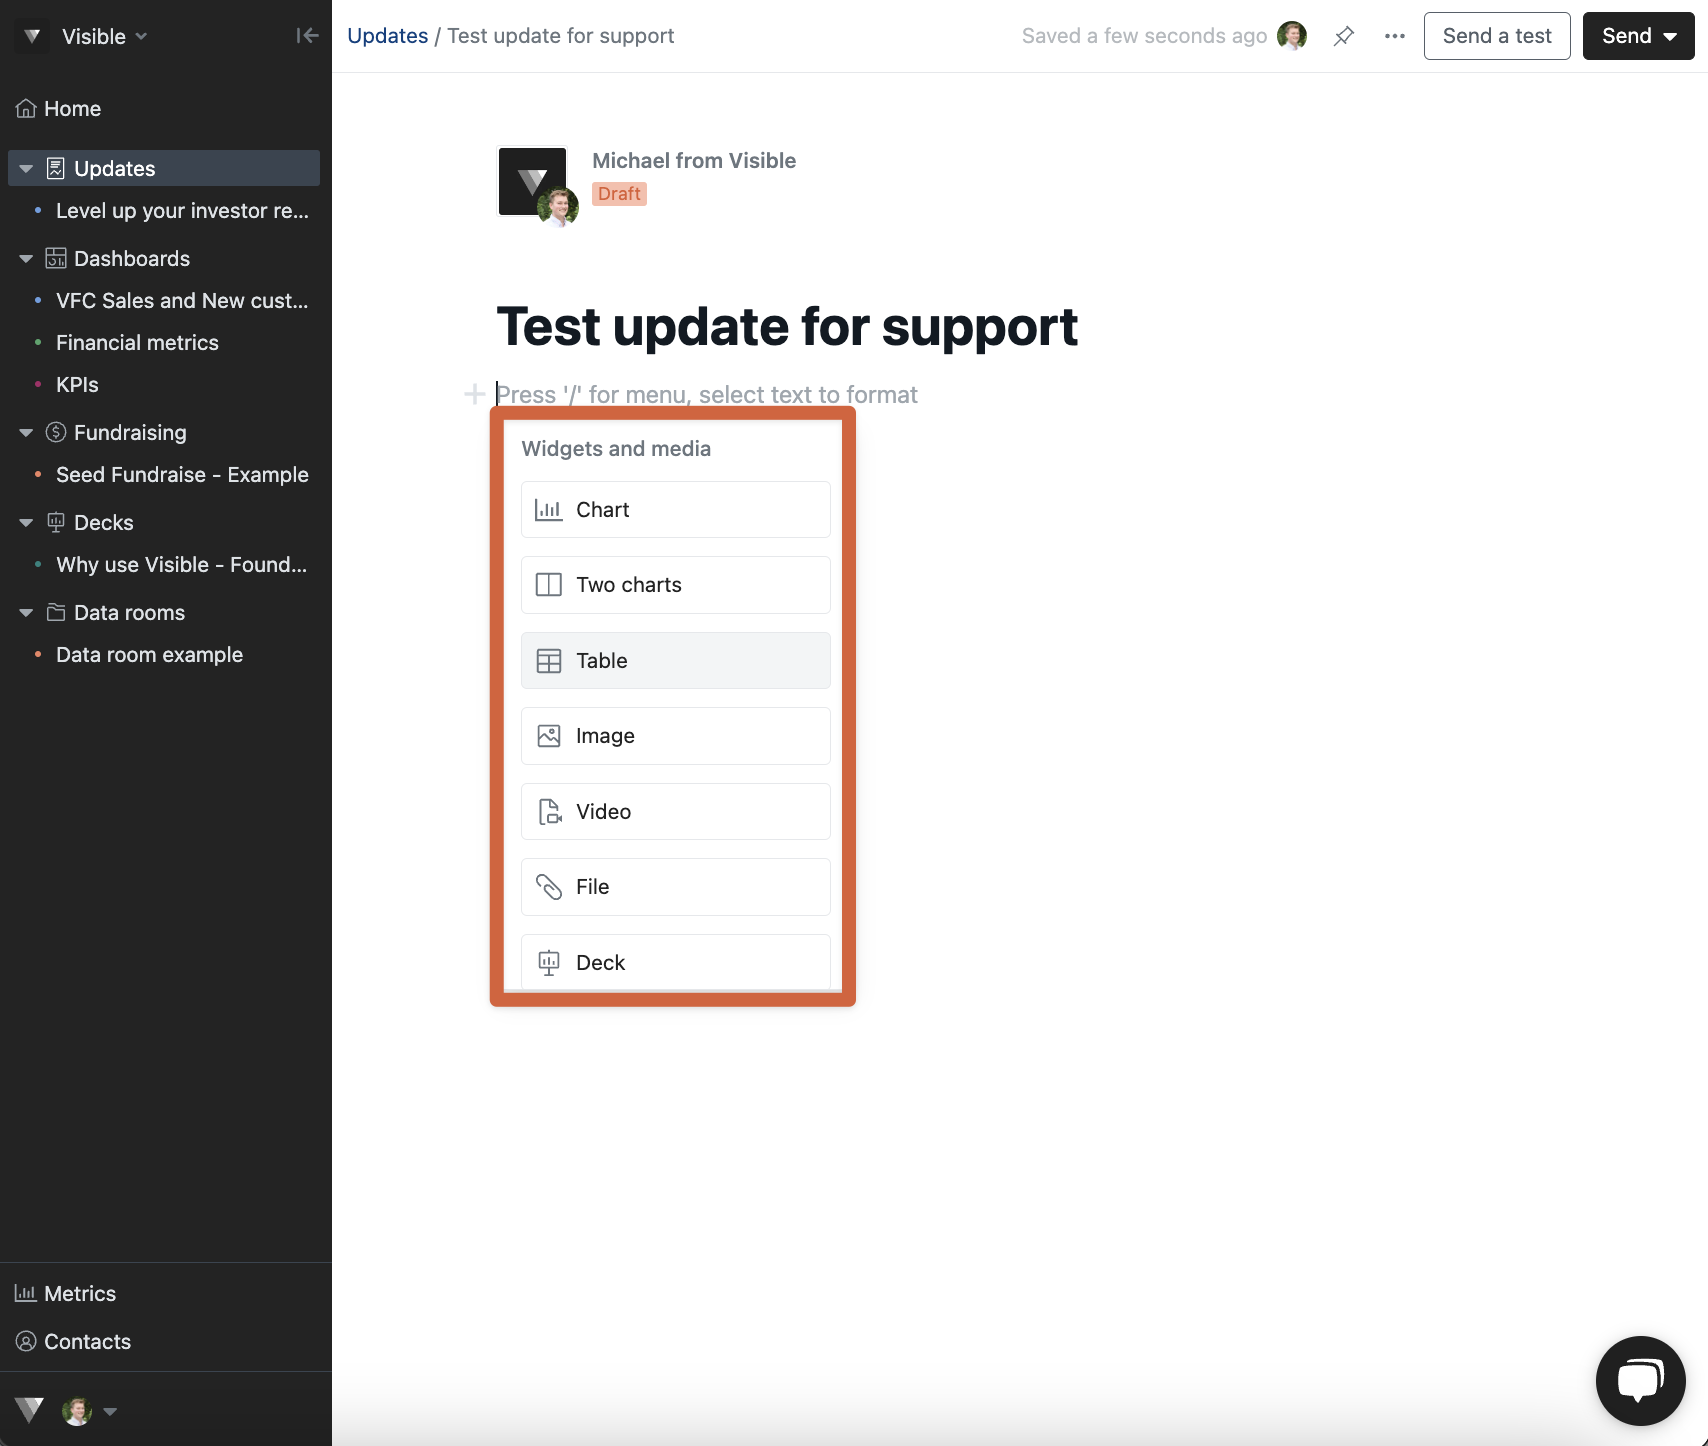
Notice the different content adding options
Click Chart
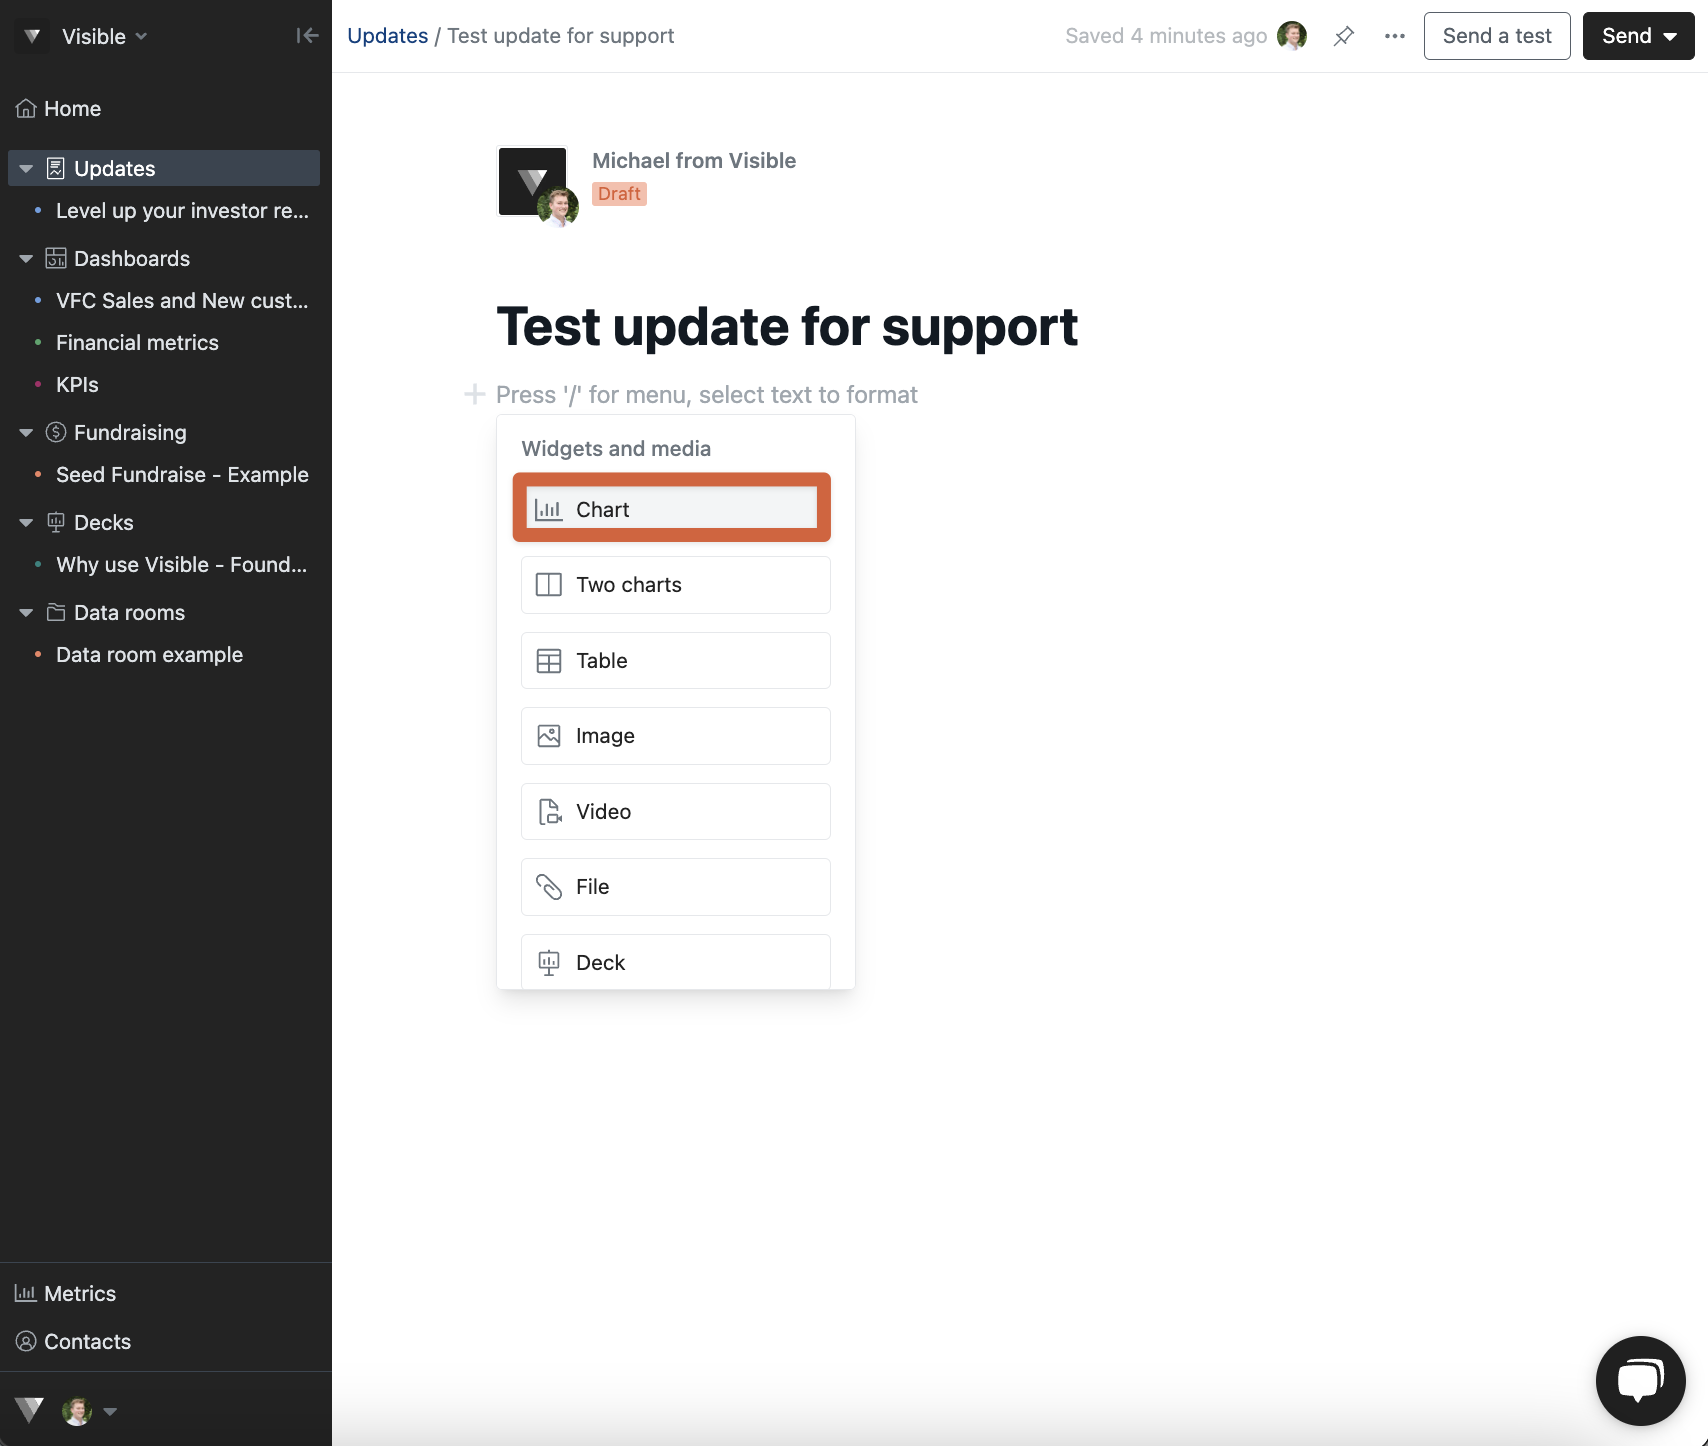
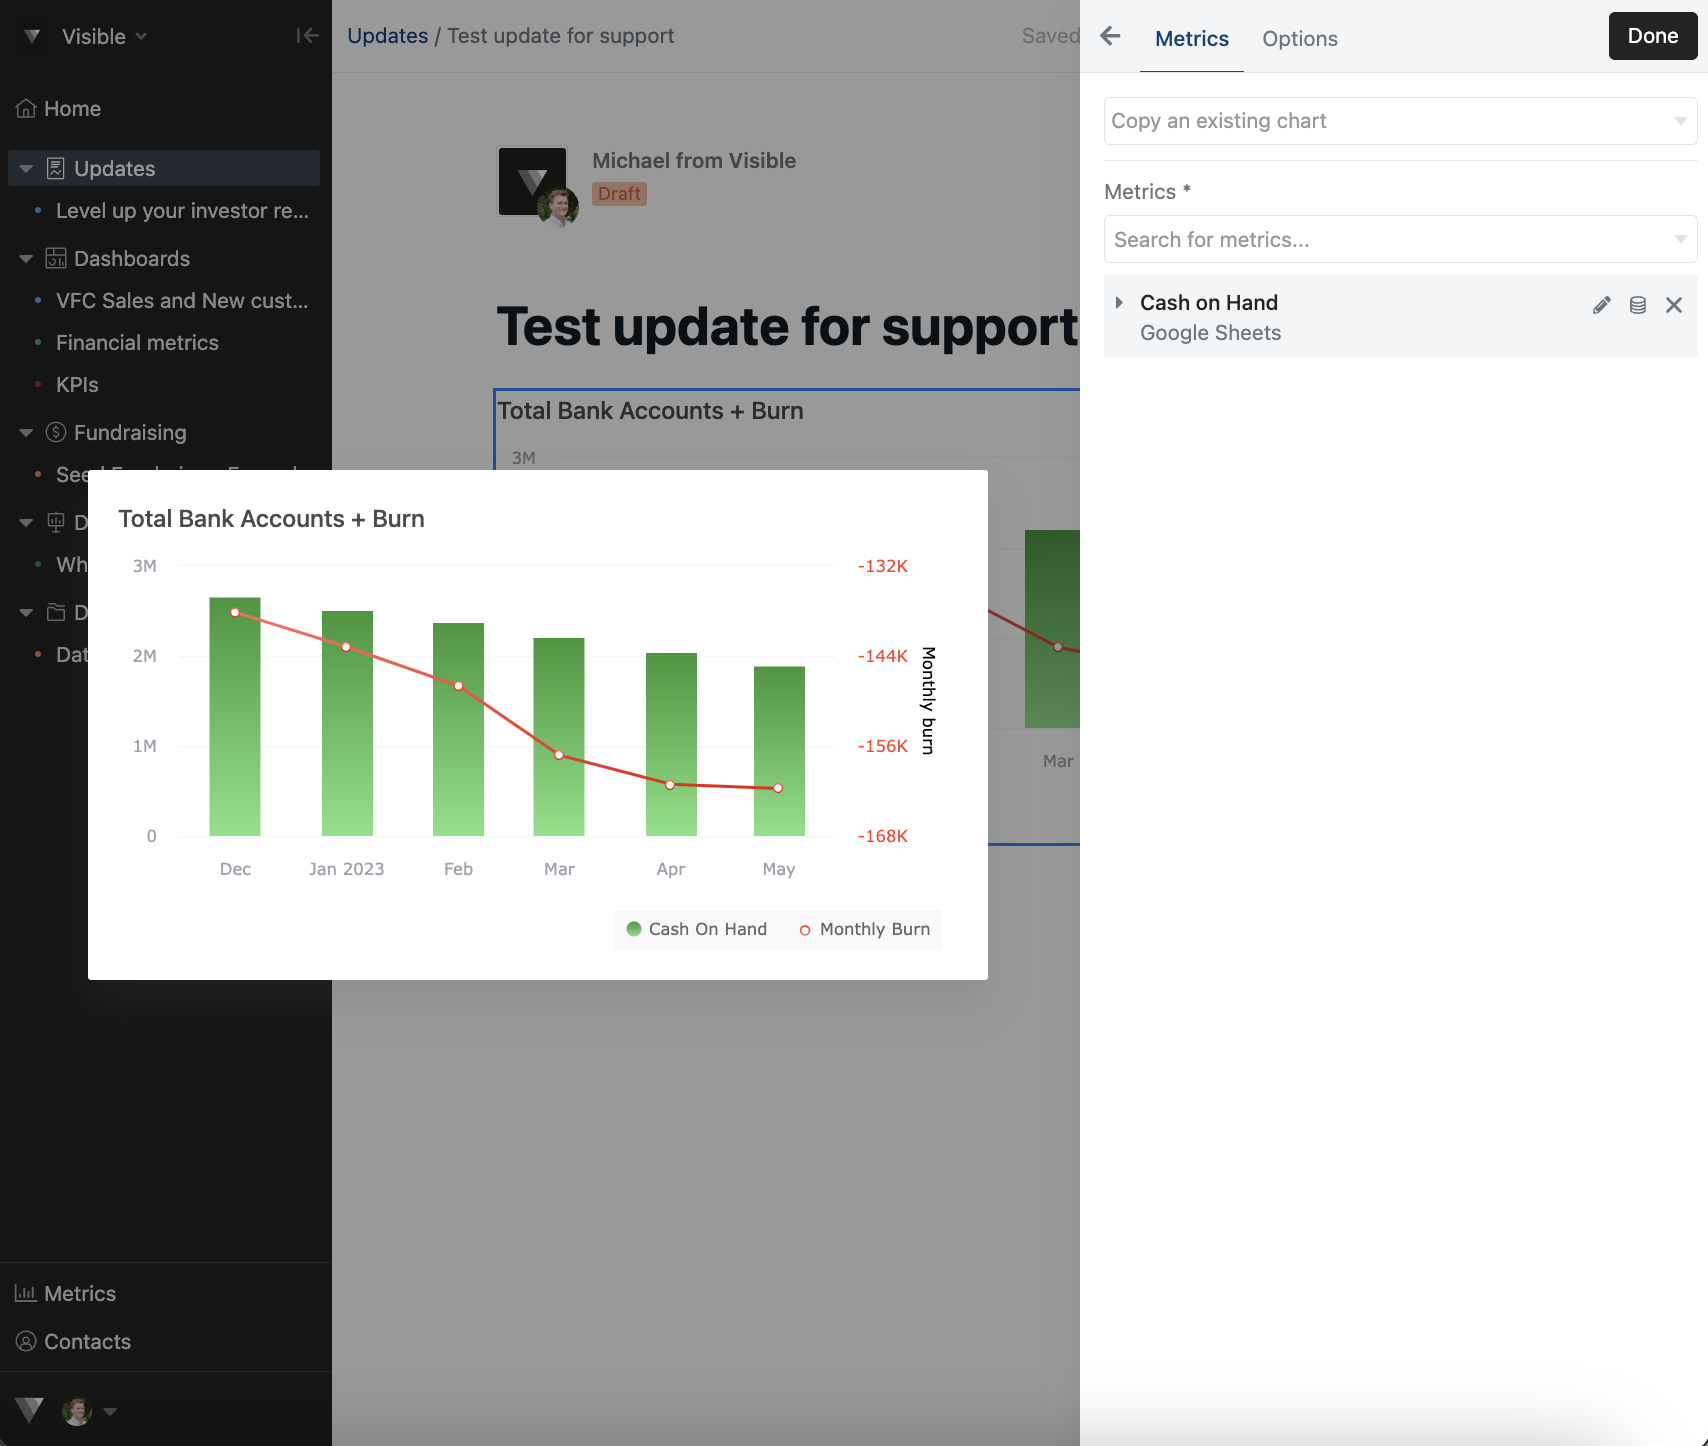
This will open the chart editor. You can add an existing chart from your dashboard or create new charts
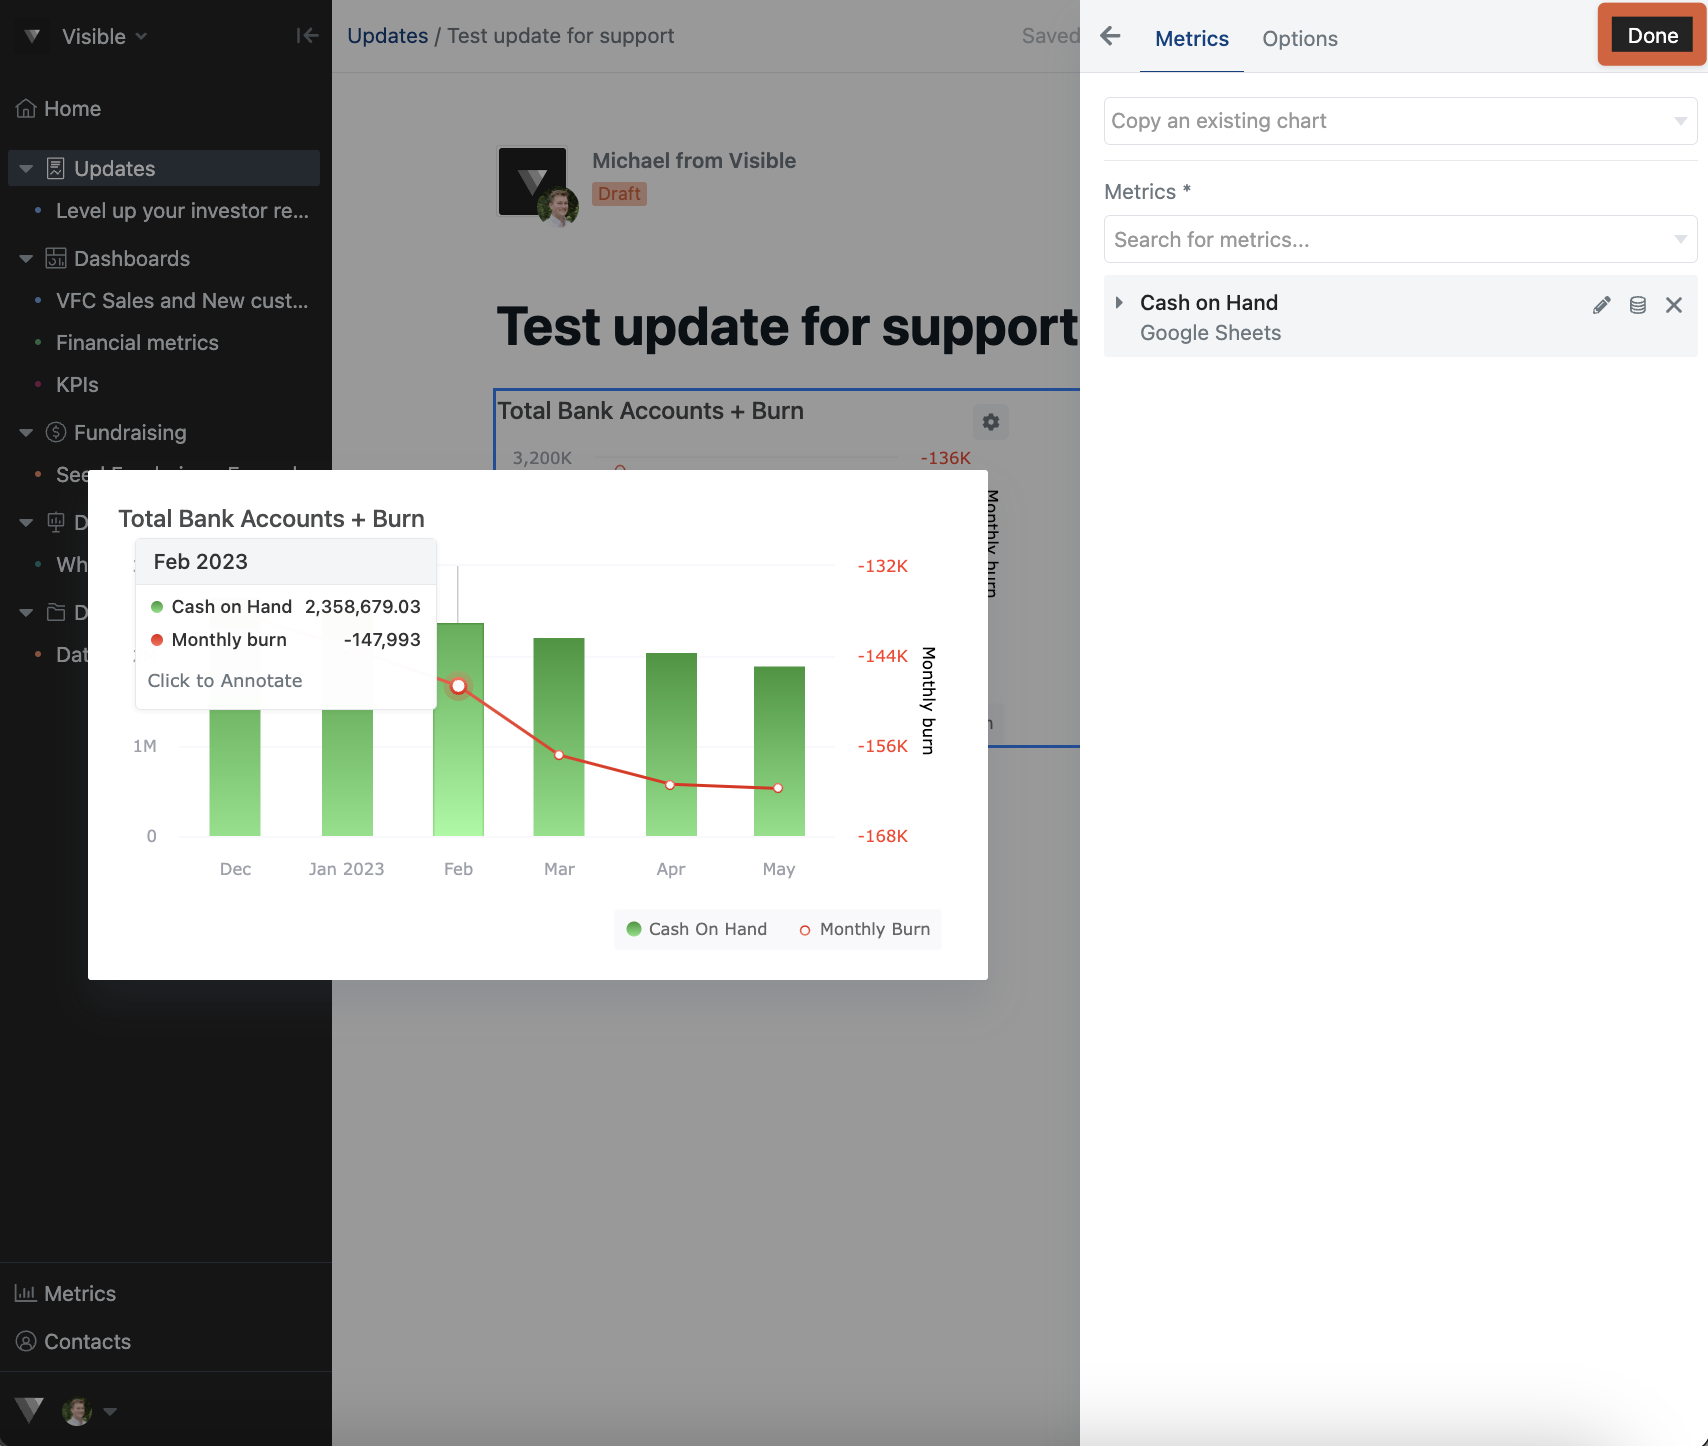
Click Done in the top right
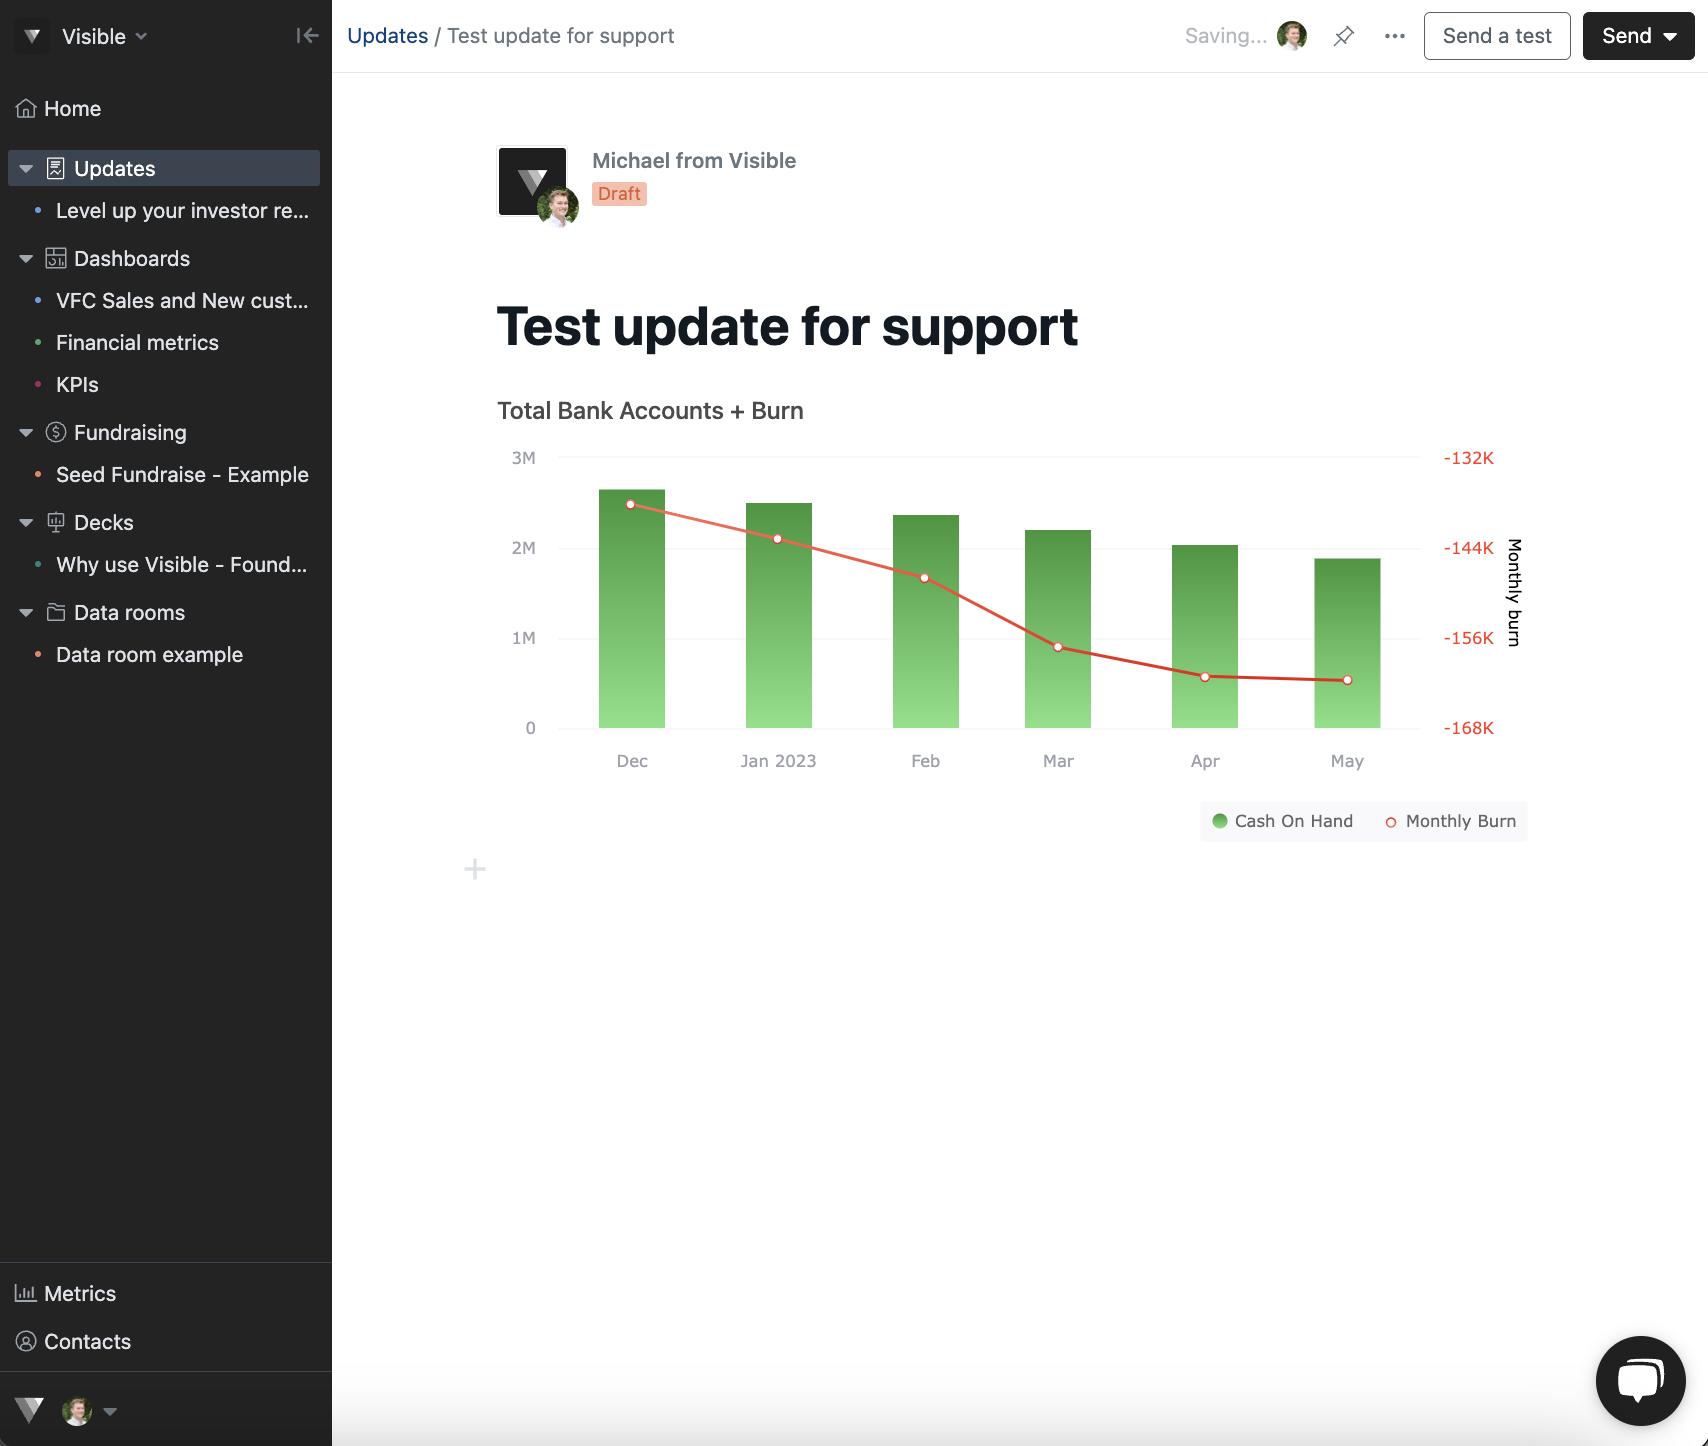
Finish drafting and sending your update!
Please reach out to our team if you have question re: adding content and sending updates!