
Article to help change the display period of a chart
You have a number of options of time frequency with which to display charts and tables. You Instead of having to upload different frequencies of data you can simply change the frequency in which the data is charted. You can change the Display period to:
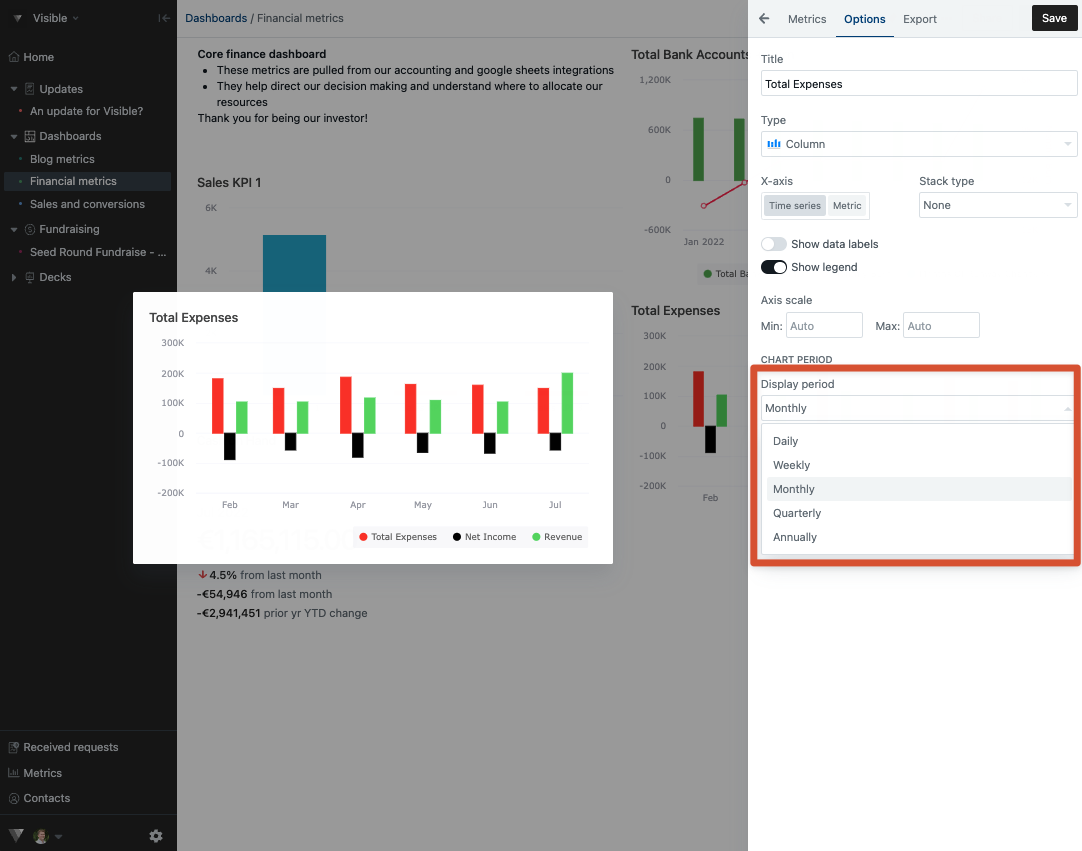
- Daily,
- Weekly,
- Monthly,
- Quarterly,
- or Annually
You can do so navigating to the chart you wish to change the display period previously. Open the dashboard, click on the three horizontal dots in the top right of the chart, and click Edit. Once in the chart editor you can click Options along the top of the editor. Notice display period towards the bottom of your chart period where you can change date frequency. Choose the frequency you would like and click Save in the top right corner.
See screenshot below!
Please let us know if you have any additional questions!