
How to chart a metric on the x-axis as opposed to date
To chart a metric on the x-axis you will need to open Visible and open the dashboard where you want your chart to live. From here you will want to click + New in the top right of your dashboard then click Chart. This will open the chart builder for you. Click Search for metrics... and add the data you wish to chart to the chart builder. Then click Options along the top of your chart builder. From the Options tab you will want to select the Metric button for the X-axis. Click Save and your chart will be saved to your dashboard and refreshed daily
See screenshots of the process below!
Open Visible
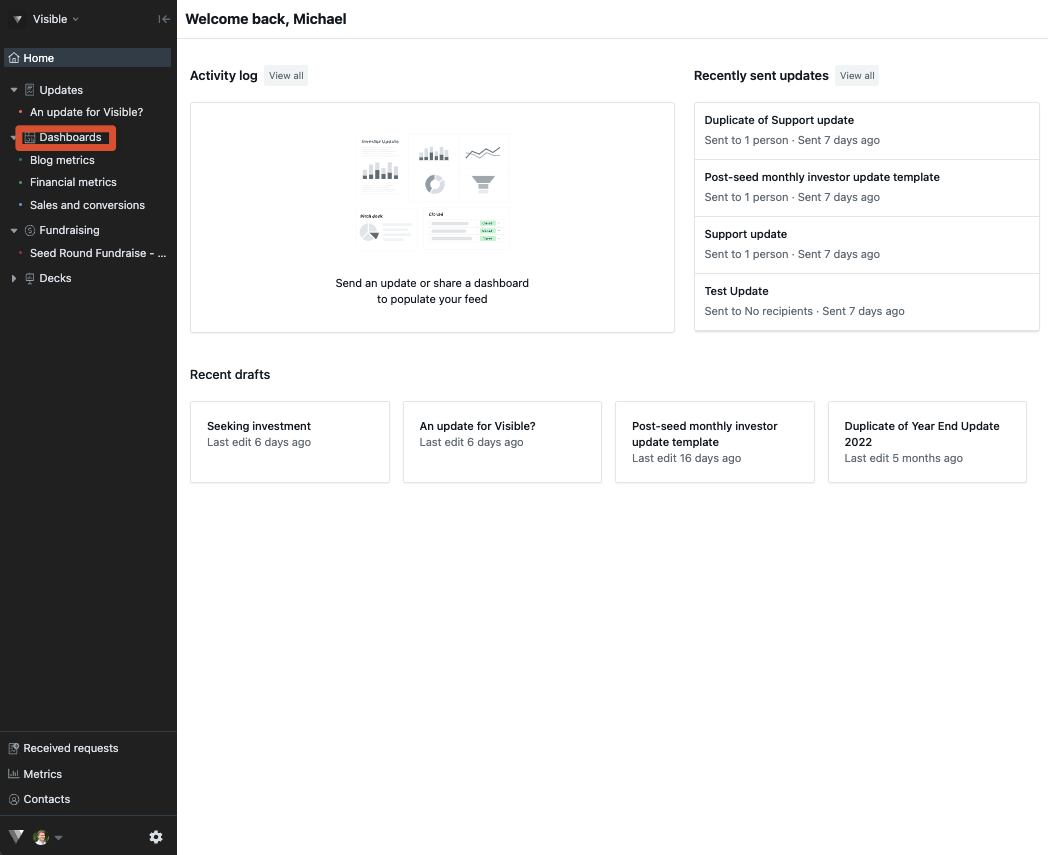
Click on Dashboards along the left side of your screen and open the dashboard where you'd like the chart to live
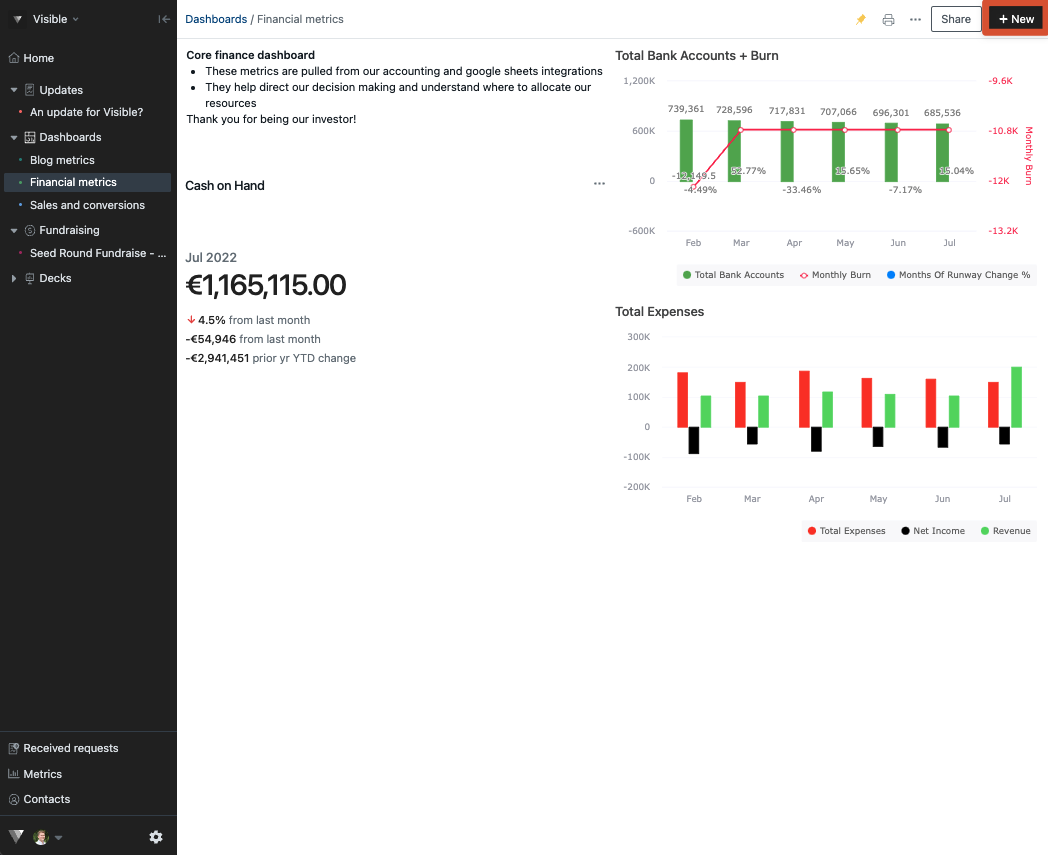
Click + New in the top right of your dashboard
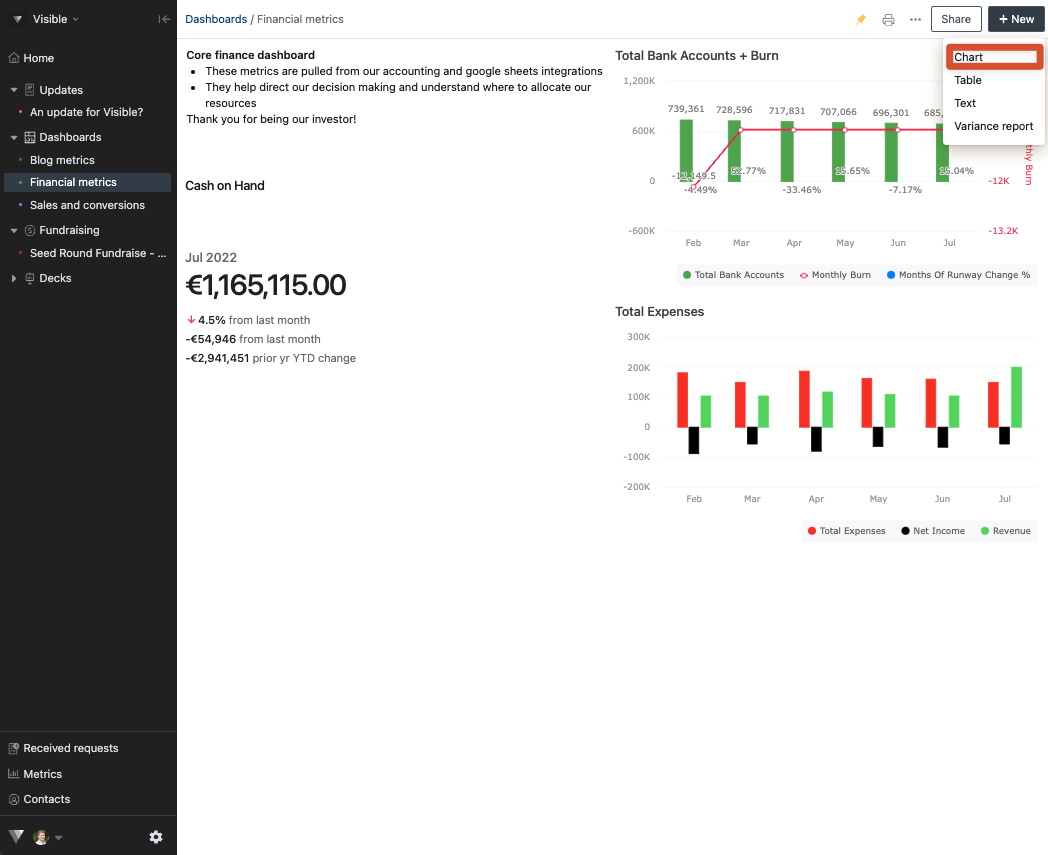
Click Chart
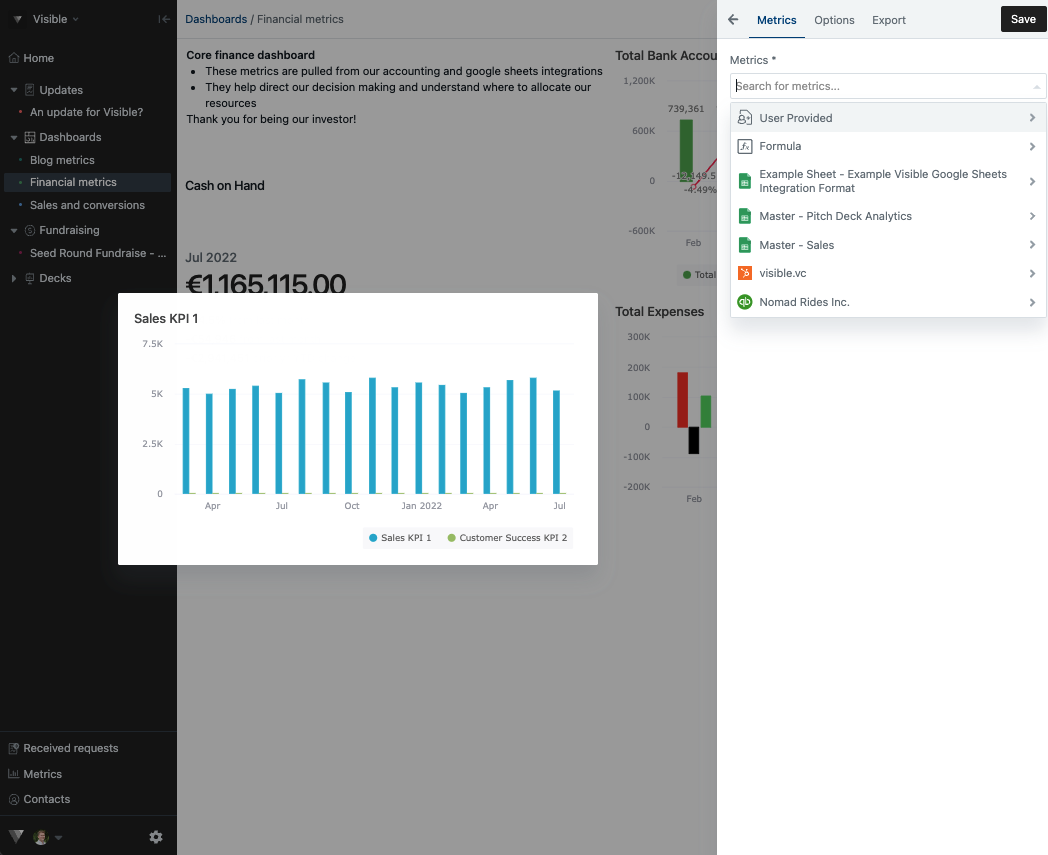
Click Search for metrics... and add the metrics you'd like to share in your chart
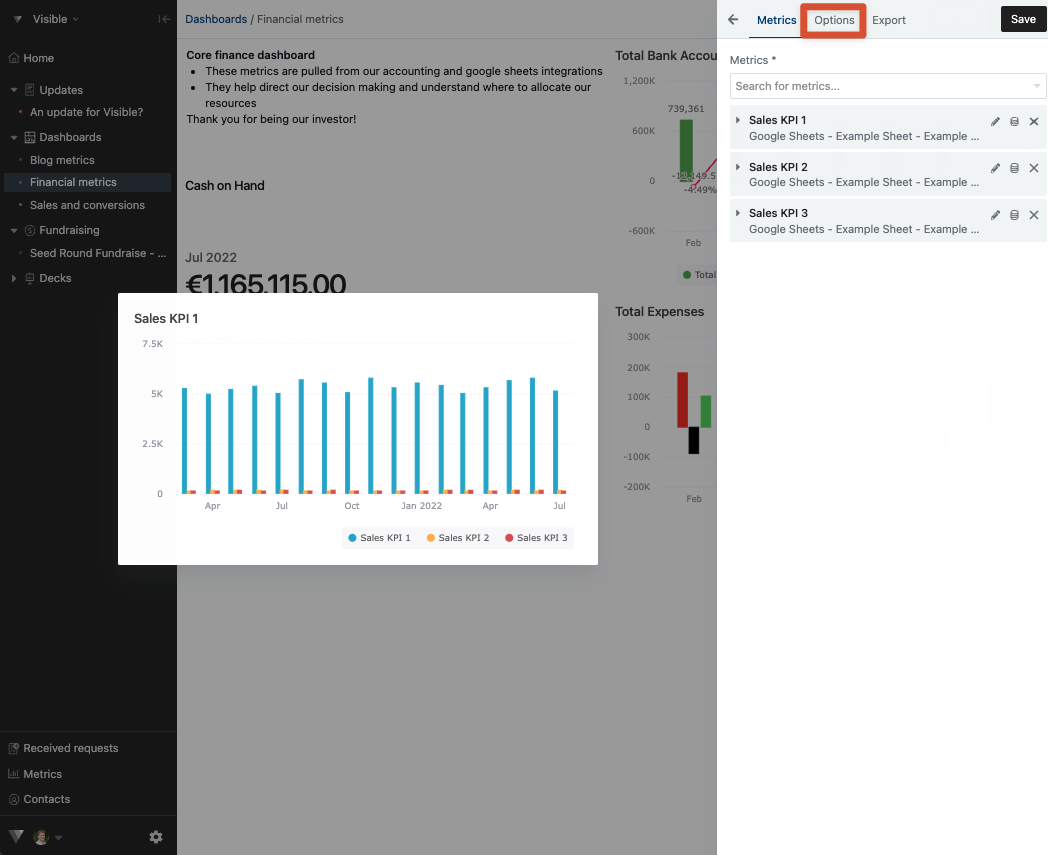
Click on Options along the top of your chart builder
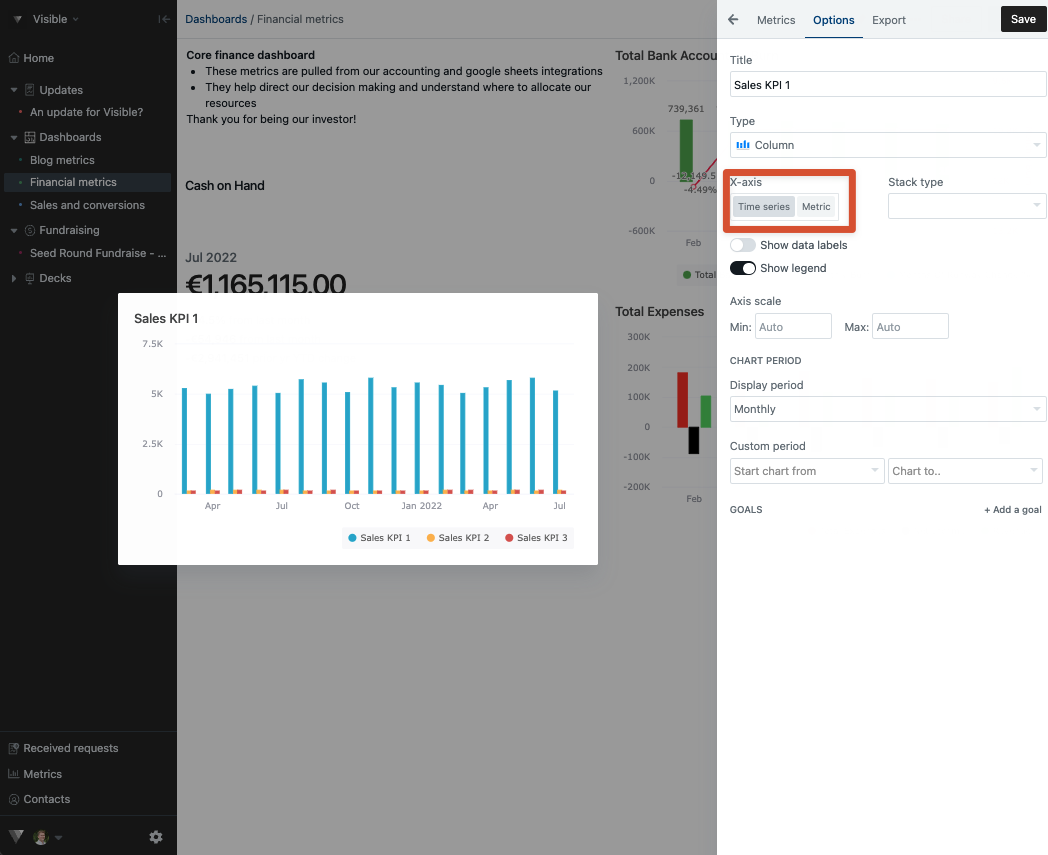
Recognize where it says X-axis in your chart builder and choose Metrics
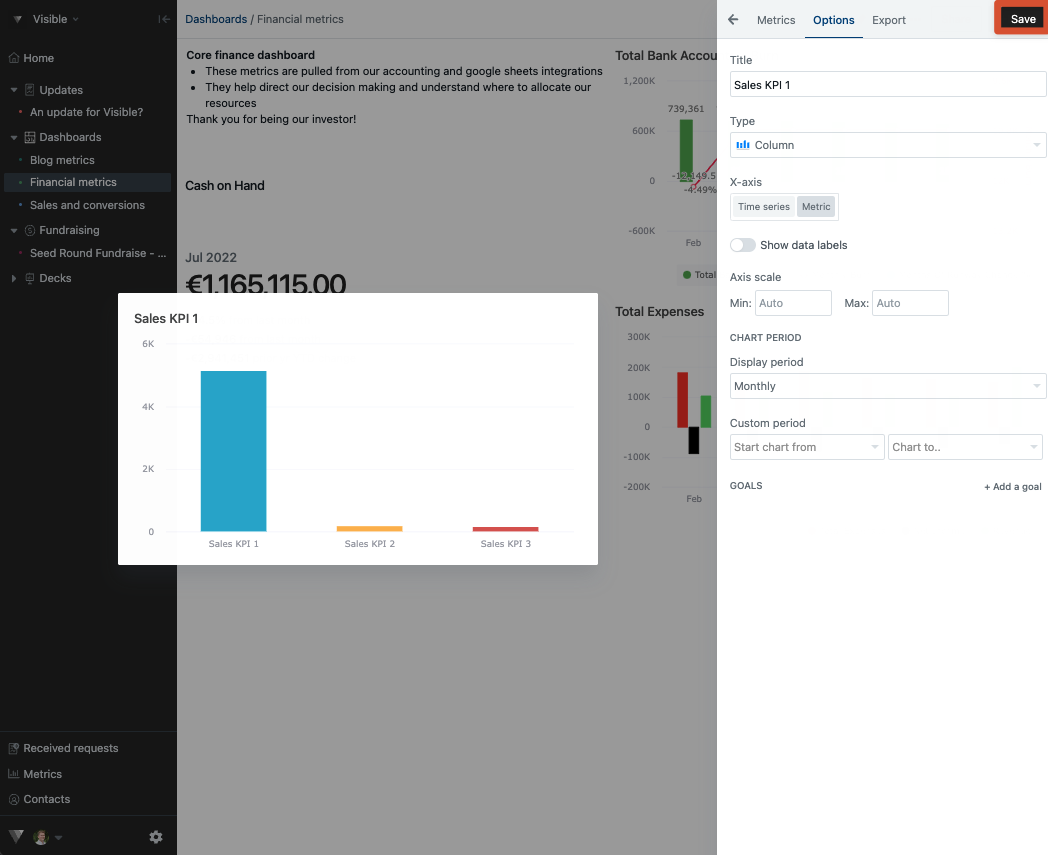
Click Save and your chart will be saved to your dashboard
Please let us know if you have any additional questions!