
To create a 2-axis chart, you will want to open Visible and click on Dashboards along the left side of your screen. Open the dashboard where you would like the 2-axis chart to live. Click the + New button in the top right corner then choose Chart. This will open a new chart builder for you. Make sure to add two metrics from user provided metrics or your integrations to your chart. Then, expand the second metric and toggle on Chart on separate Y-axis.
See screenshots of the process below!
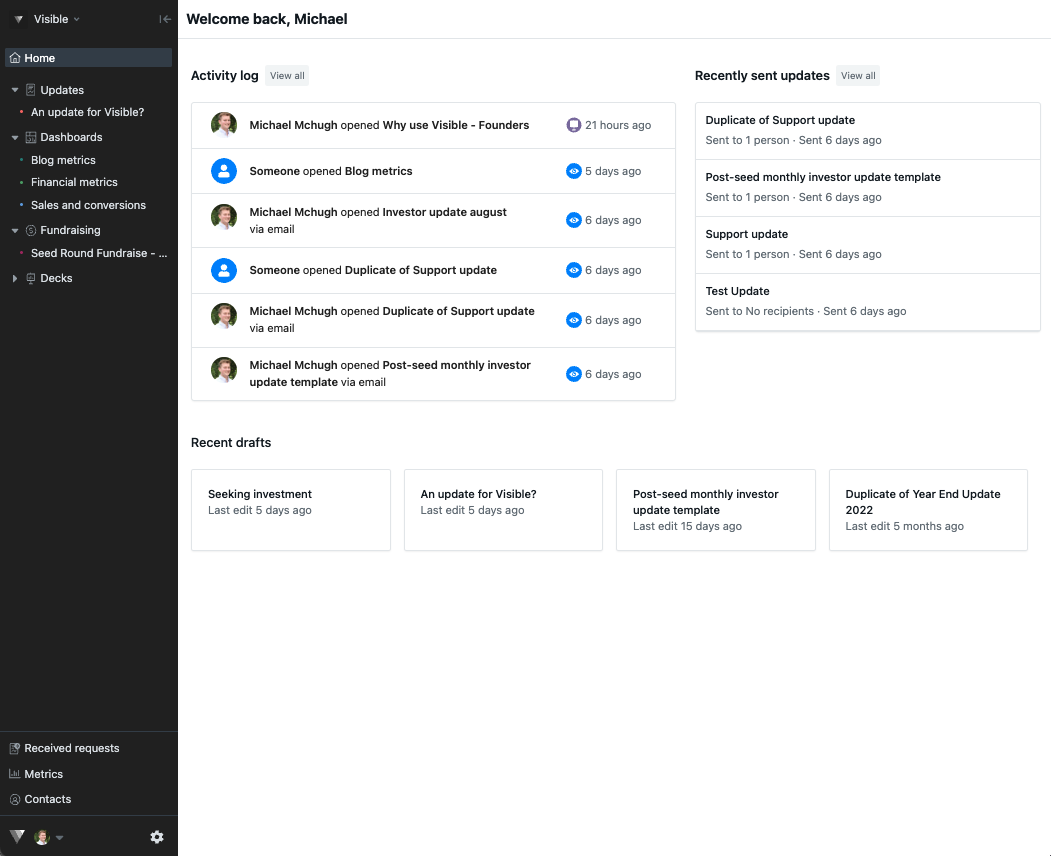
Open Visible
Click Dashboards along the left side of your screen
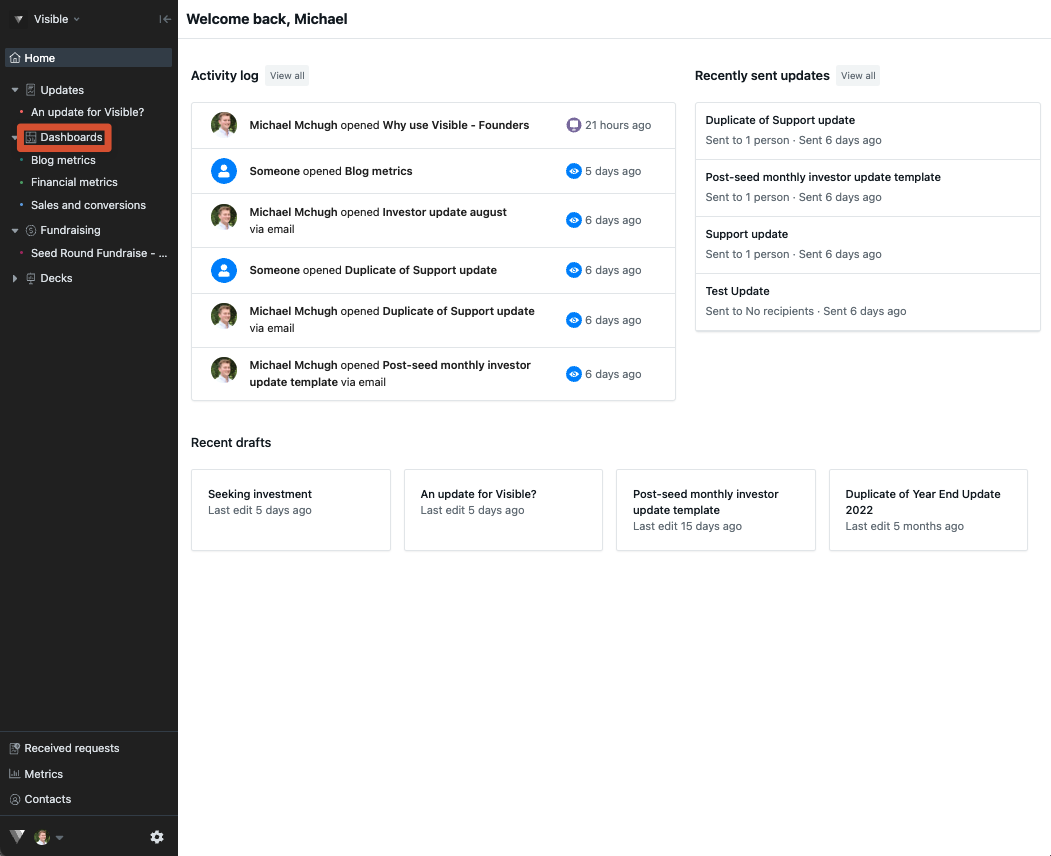
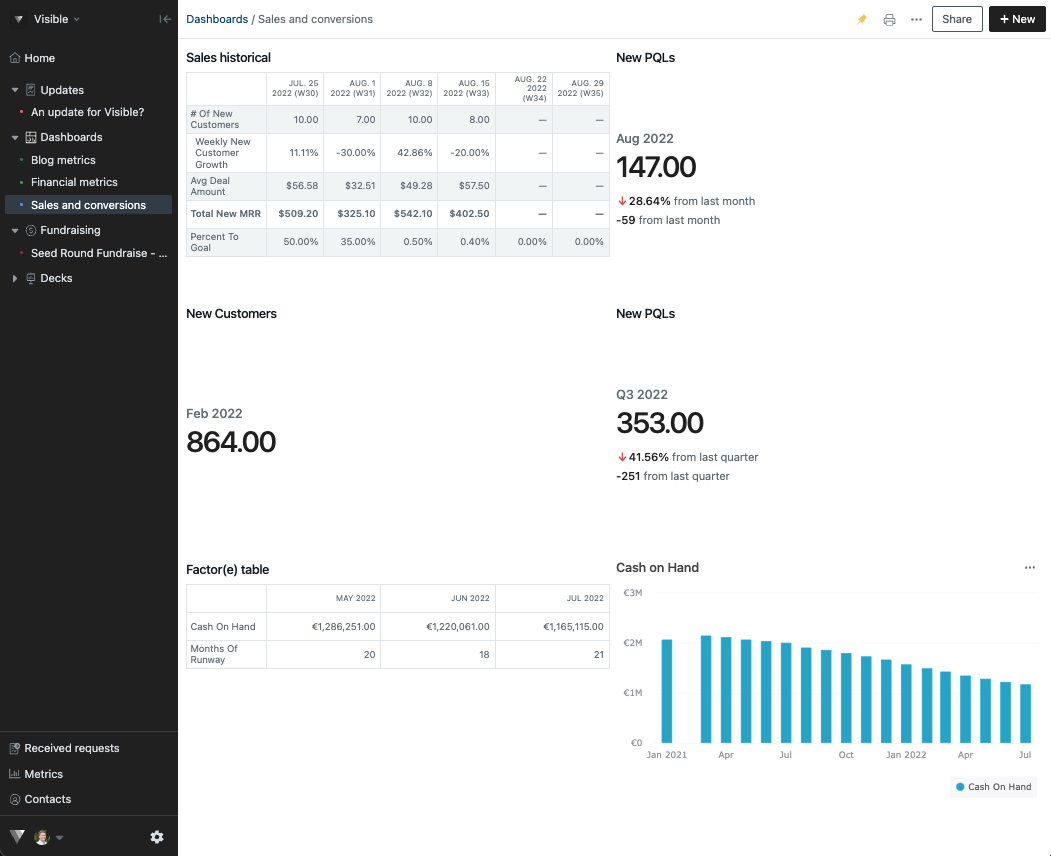
Open dashboard where you wan the chart to live
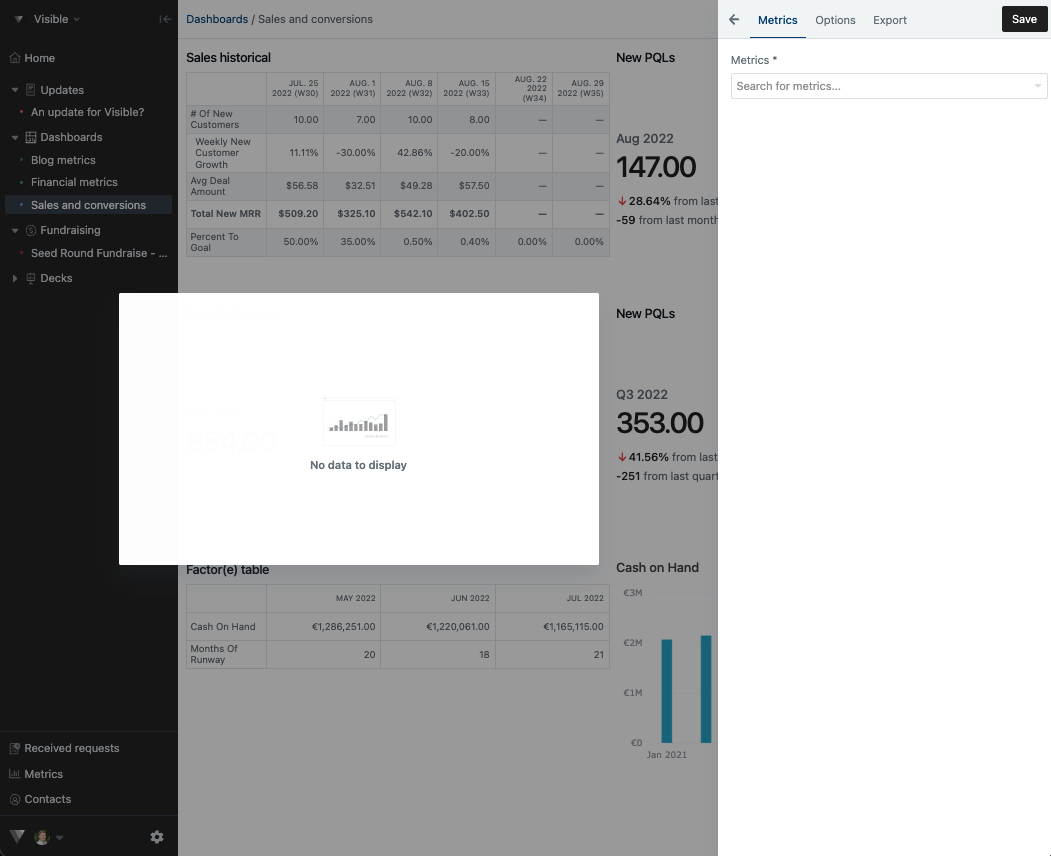
Click the + New in the top right corner and choose Chart
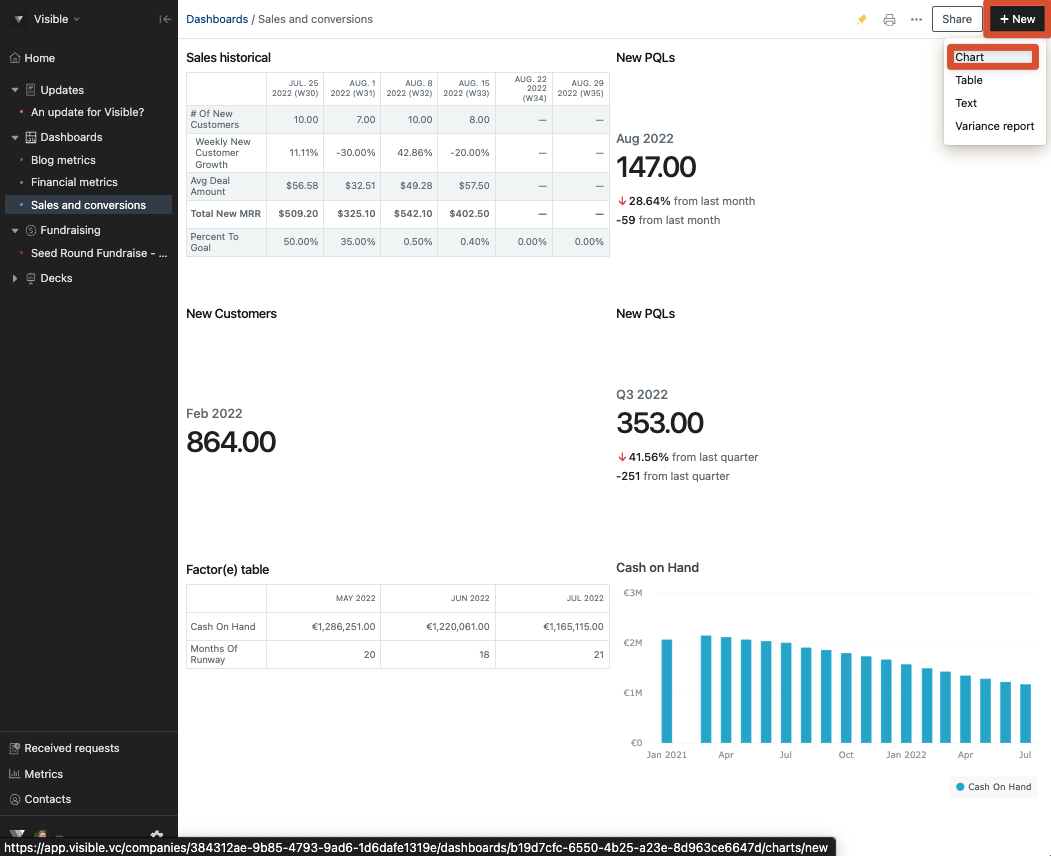
This will open the chart builder for you
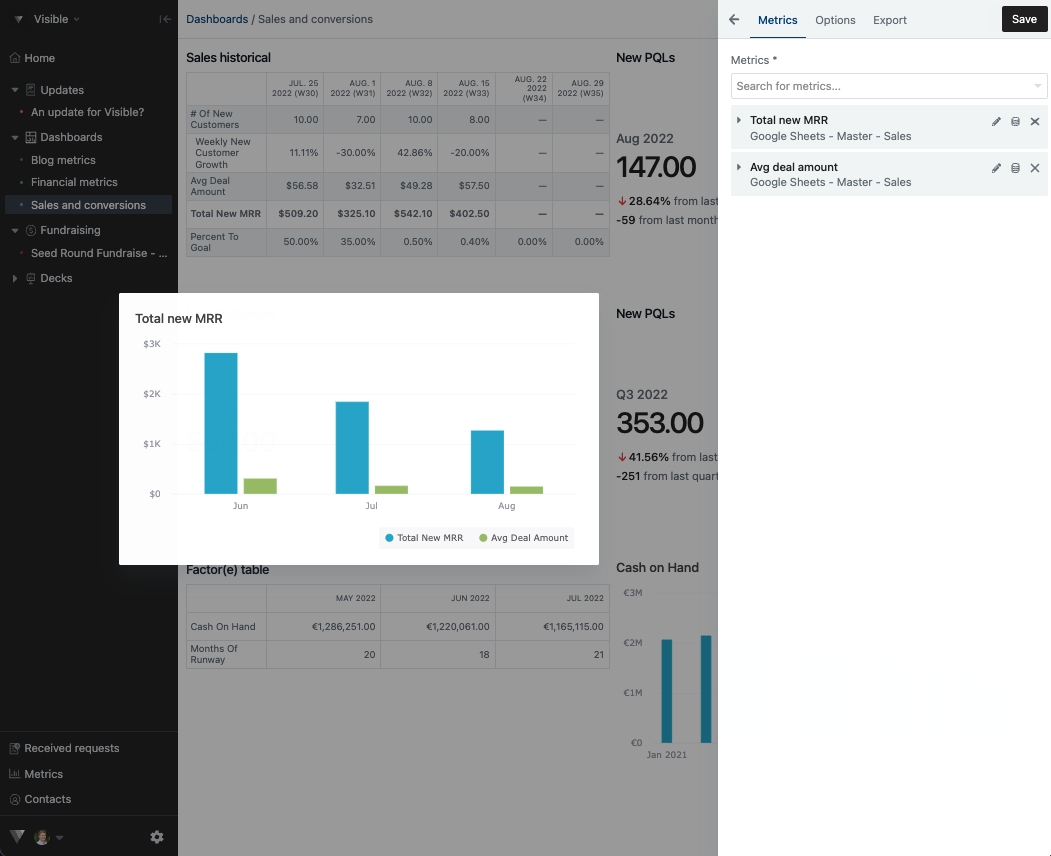
Click into Search for metrics... and add multiple metrics to your chart from user provided metrics or integrations
Open one of the metrics and toggle on Chart on separate Y-axis
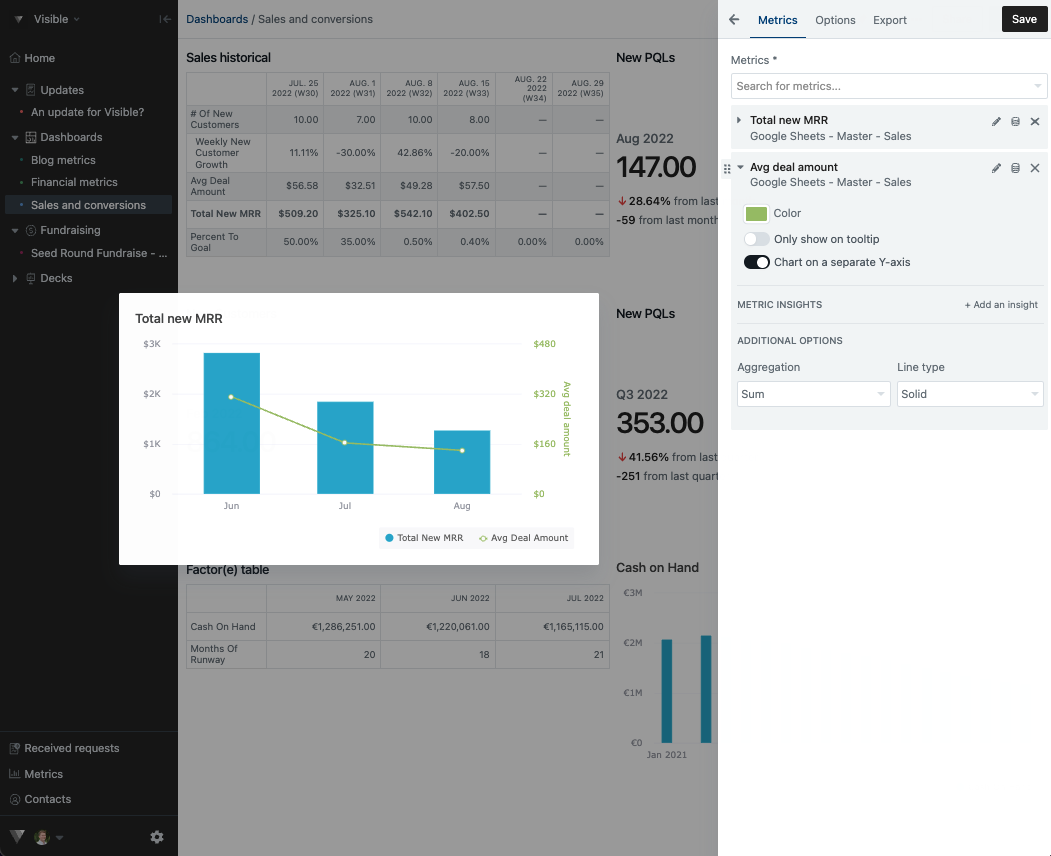
This will enable you to highlight both metrics on separate Y-axis as shown in the last screenshot. These dashboards can be shared and can also be added to your updates.
Please let us know if you have any additional questions!