
How do I create a metric and add data directly in Visible? Steps to create a metric and enter data directly in Visible.
The answer you're looking for is creating User provided metrics. Read more about using User provided metric here.
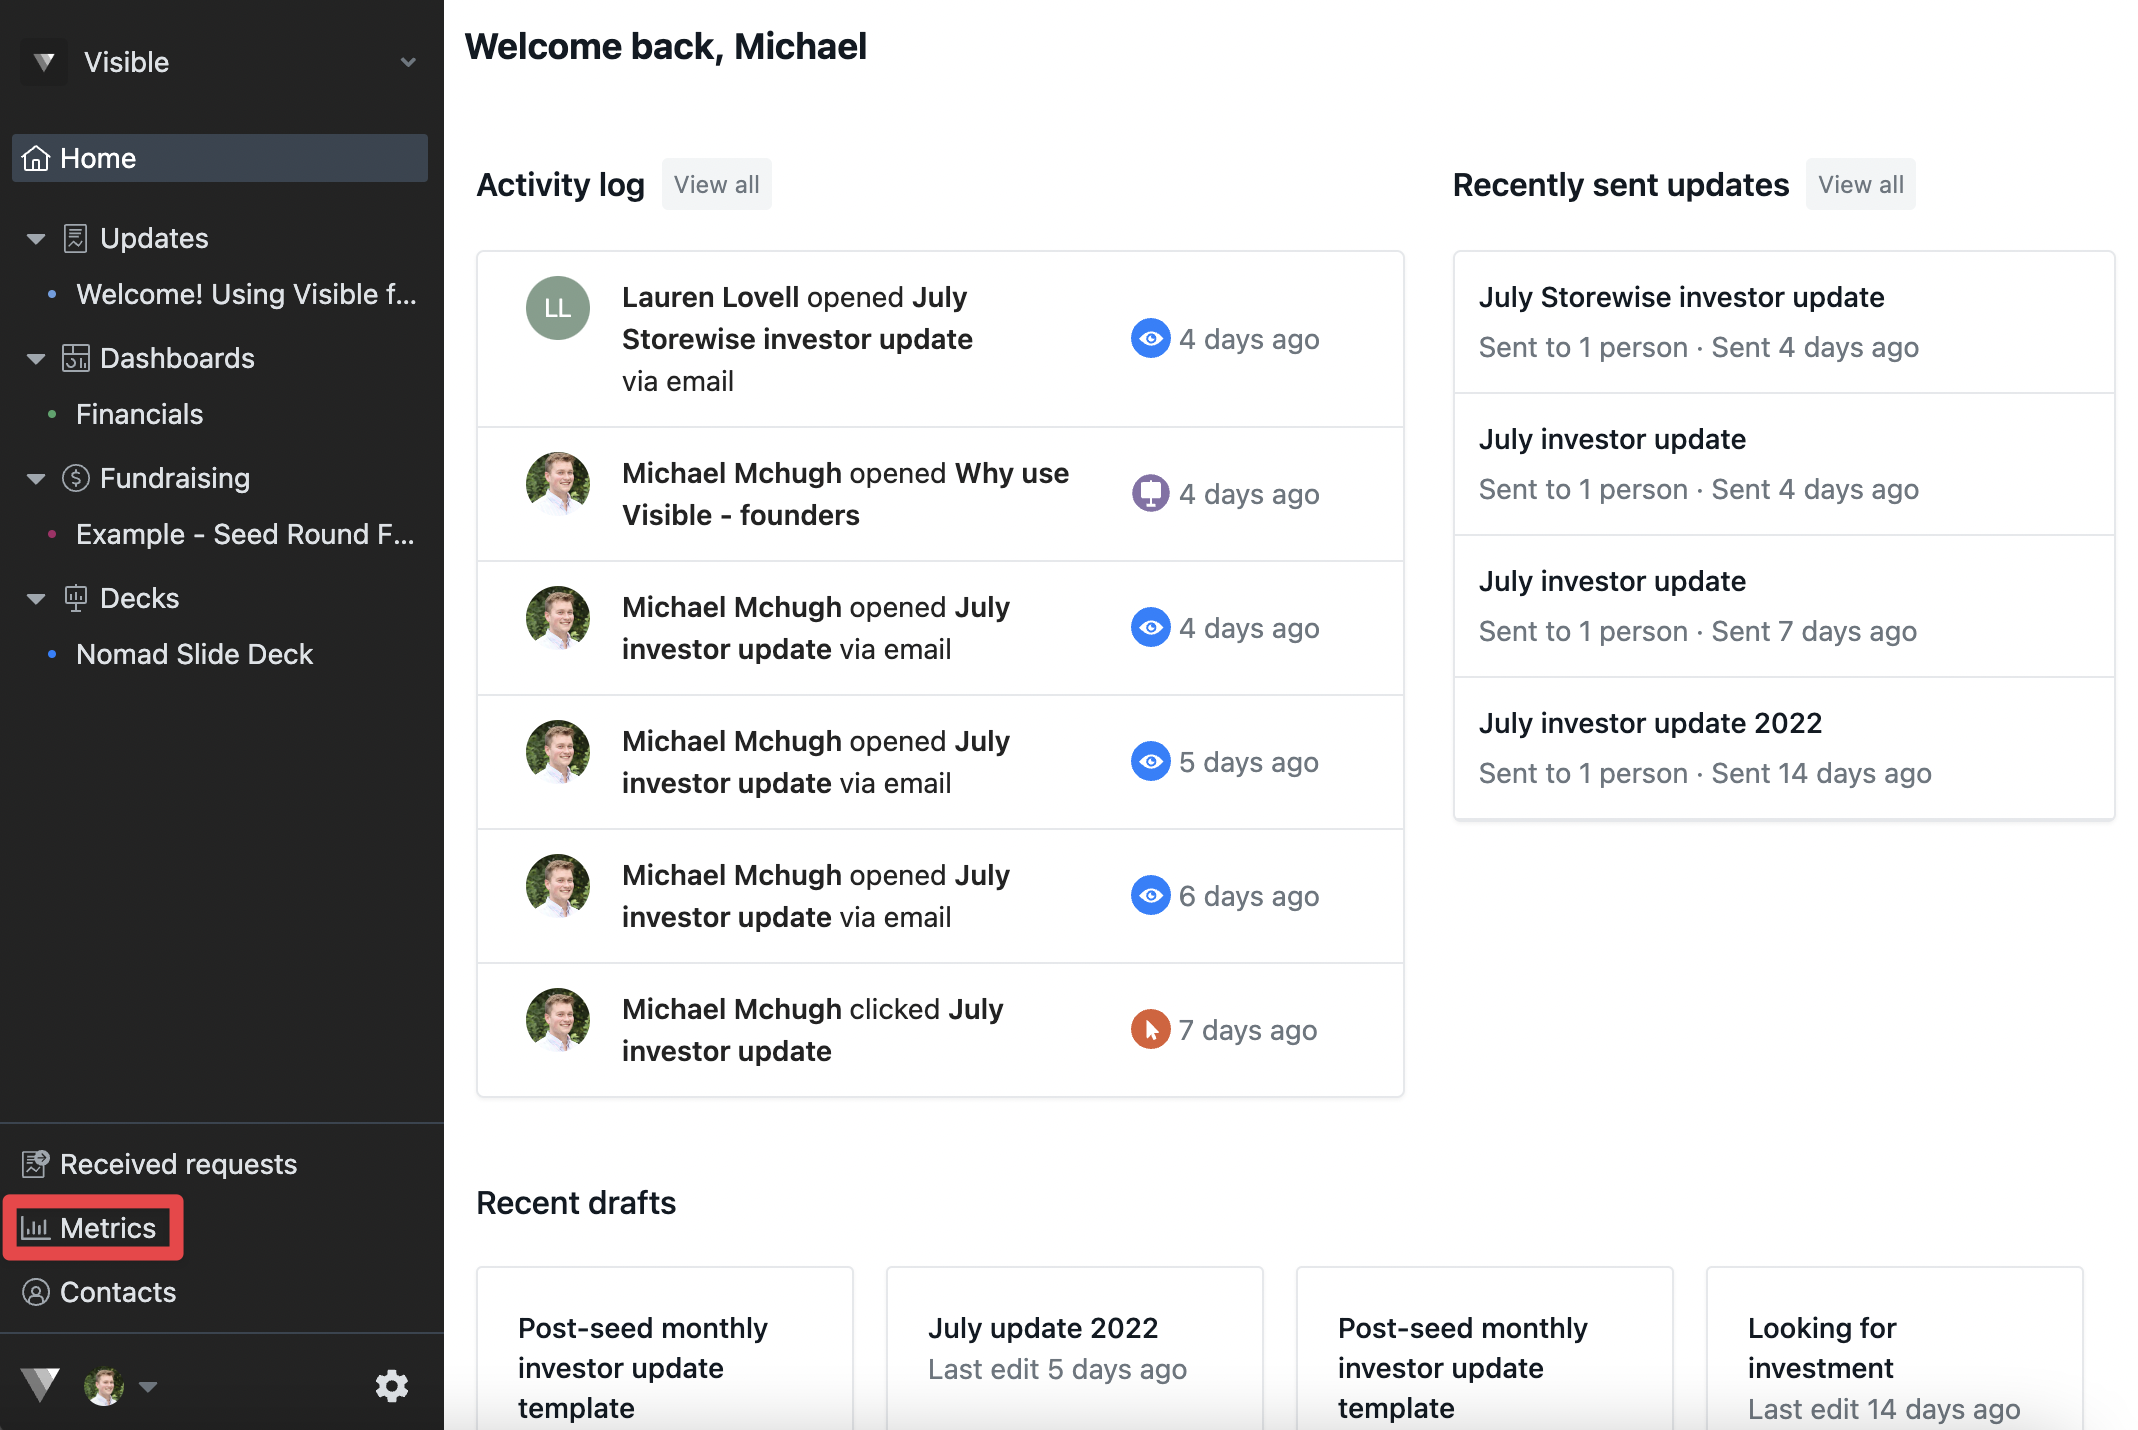
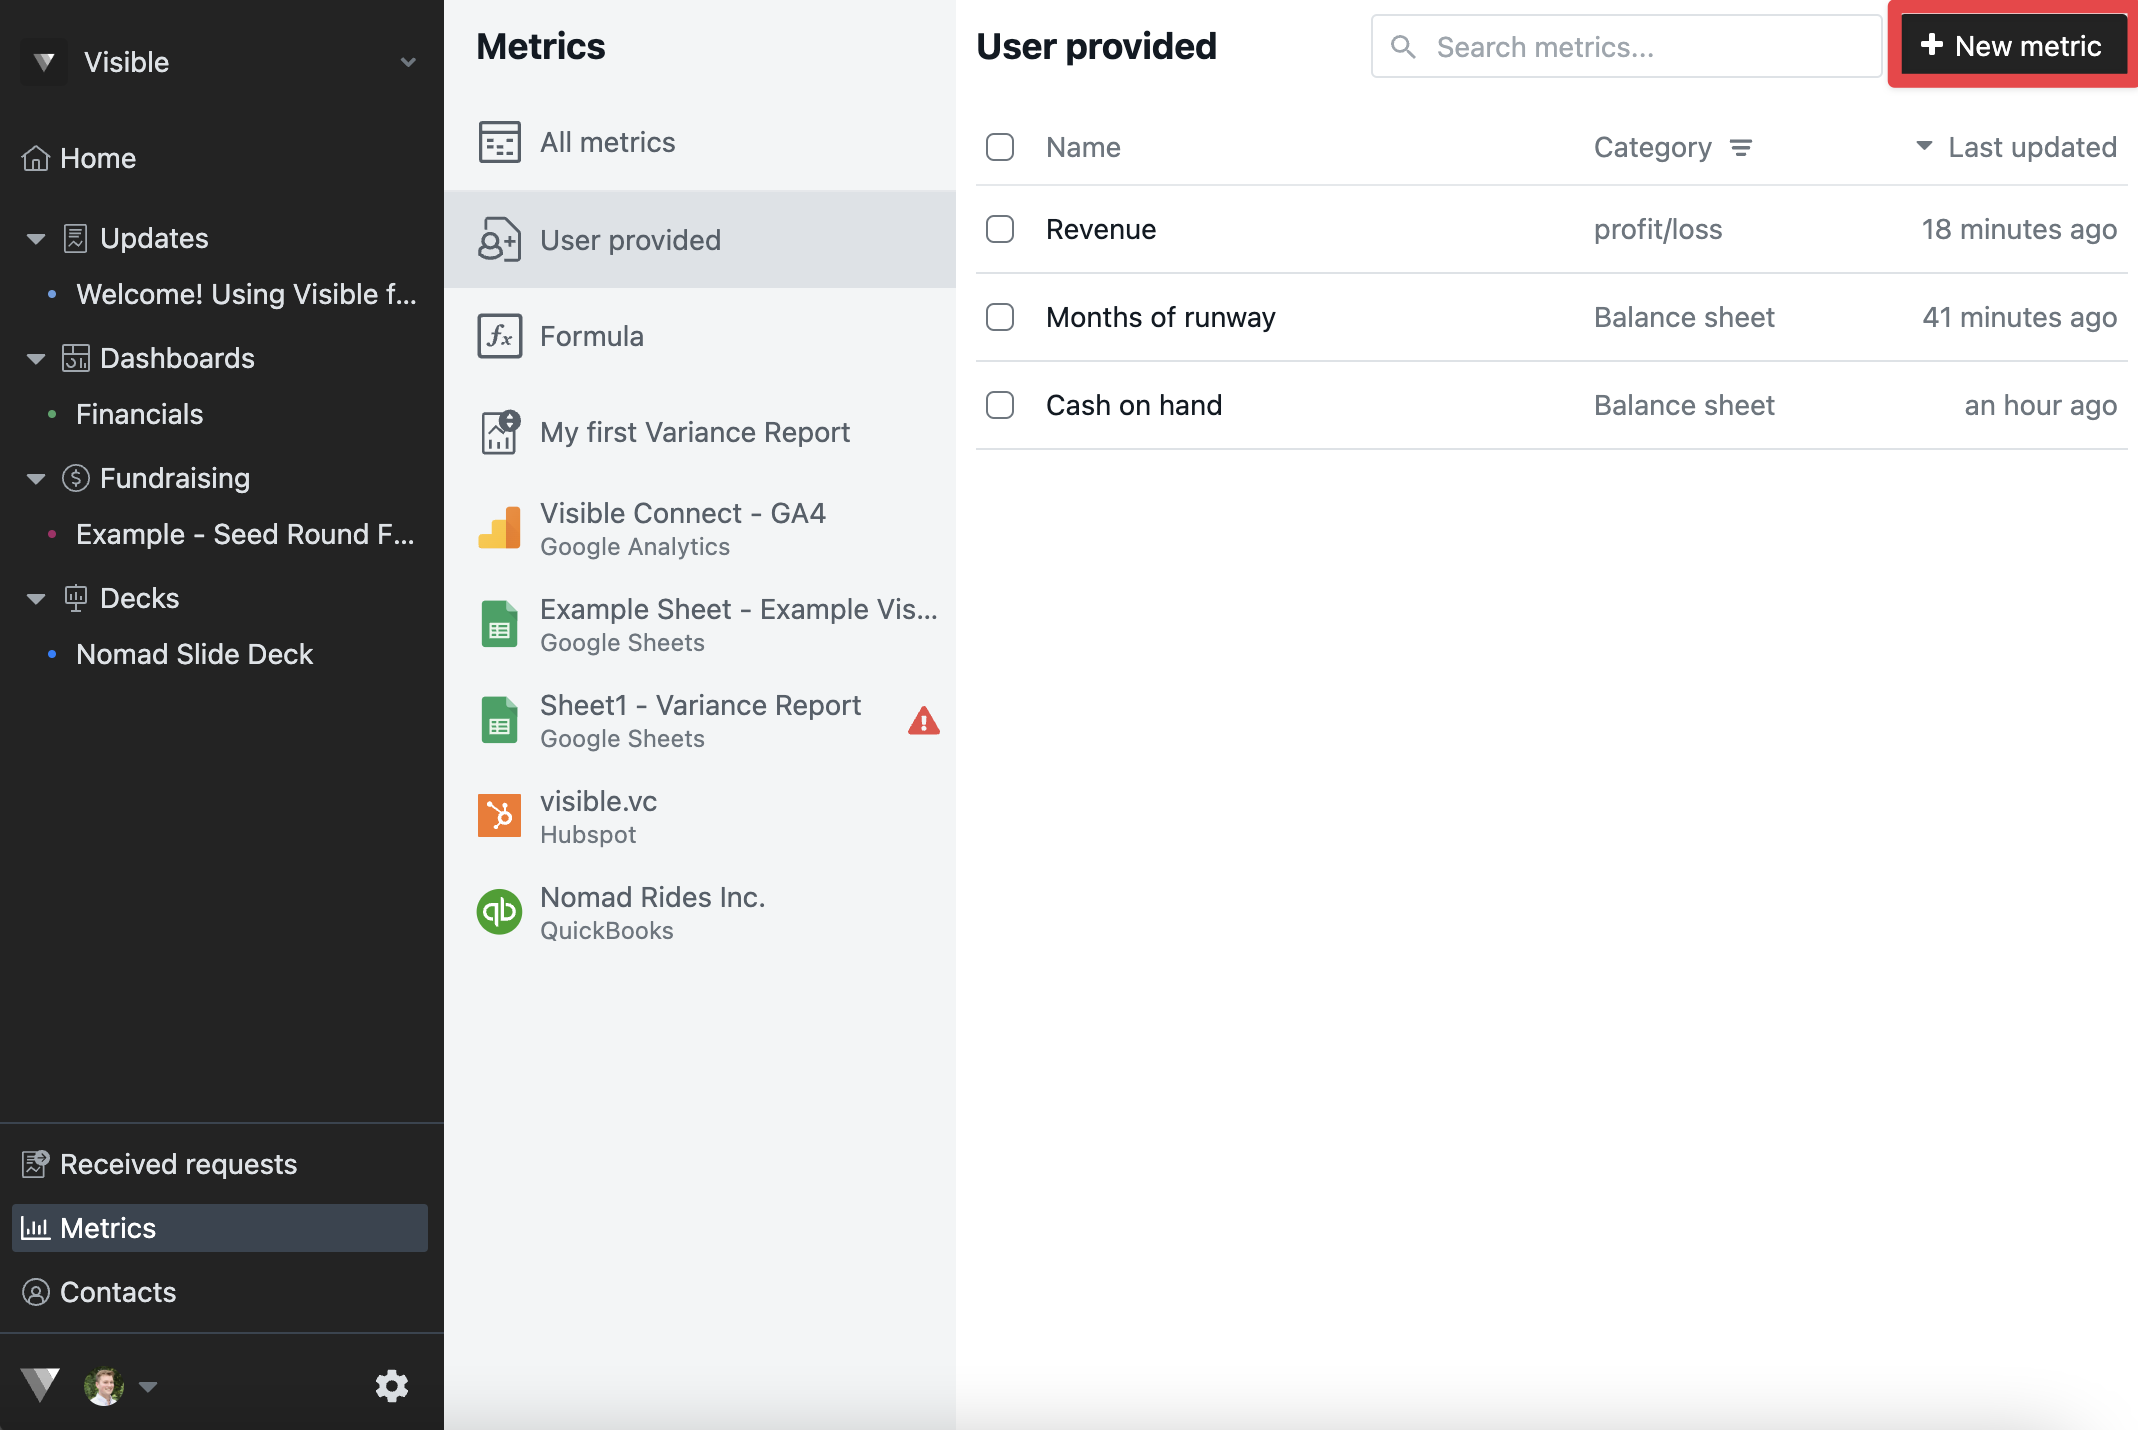
To upload User provided metrics to your account, You'll want to open your Visible app and click on Metrics in the bottom left hand corner of the app. Next, click on the second page User provided along the left side of your screen. Then, click on + New metric in the top right corner.
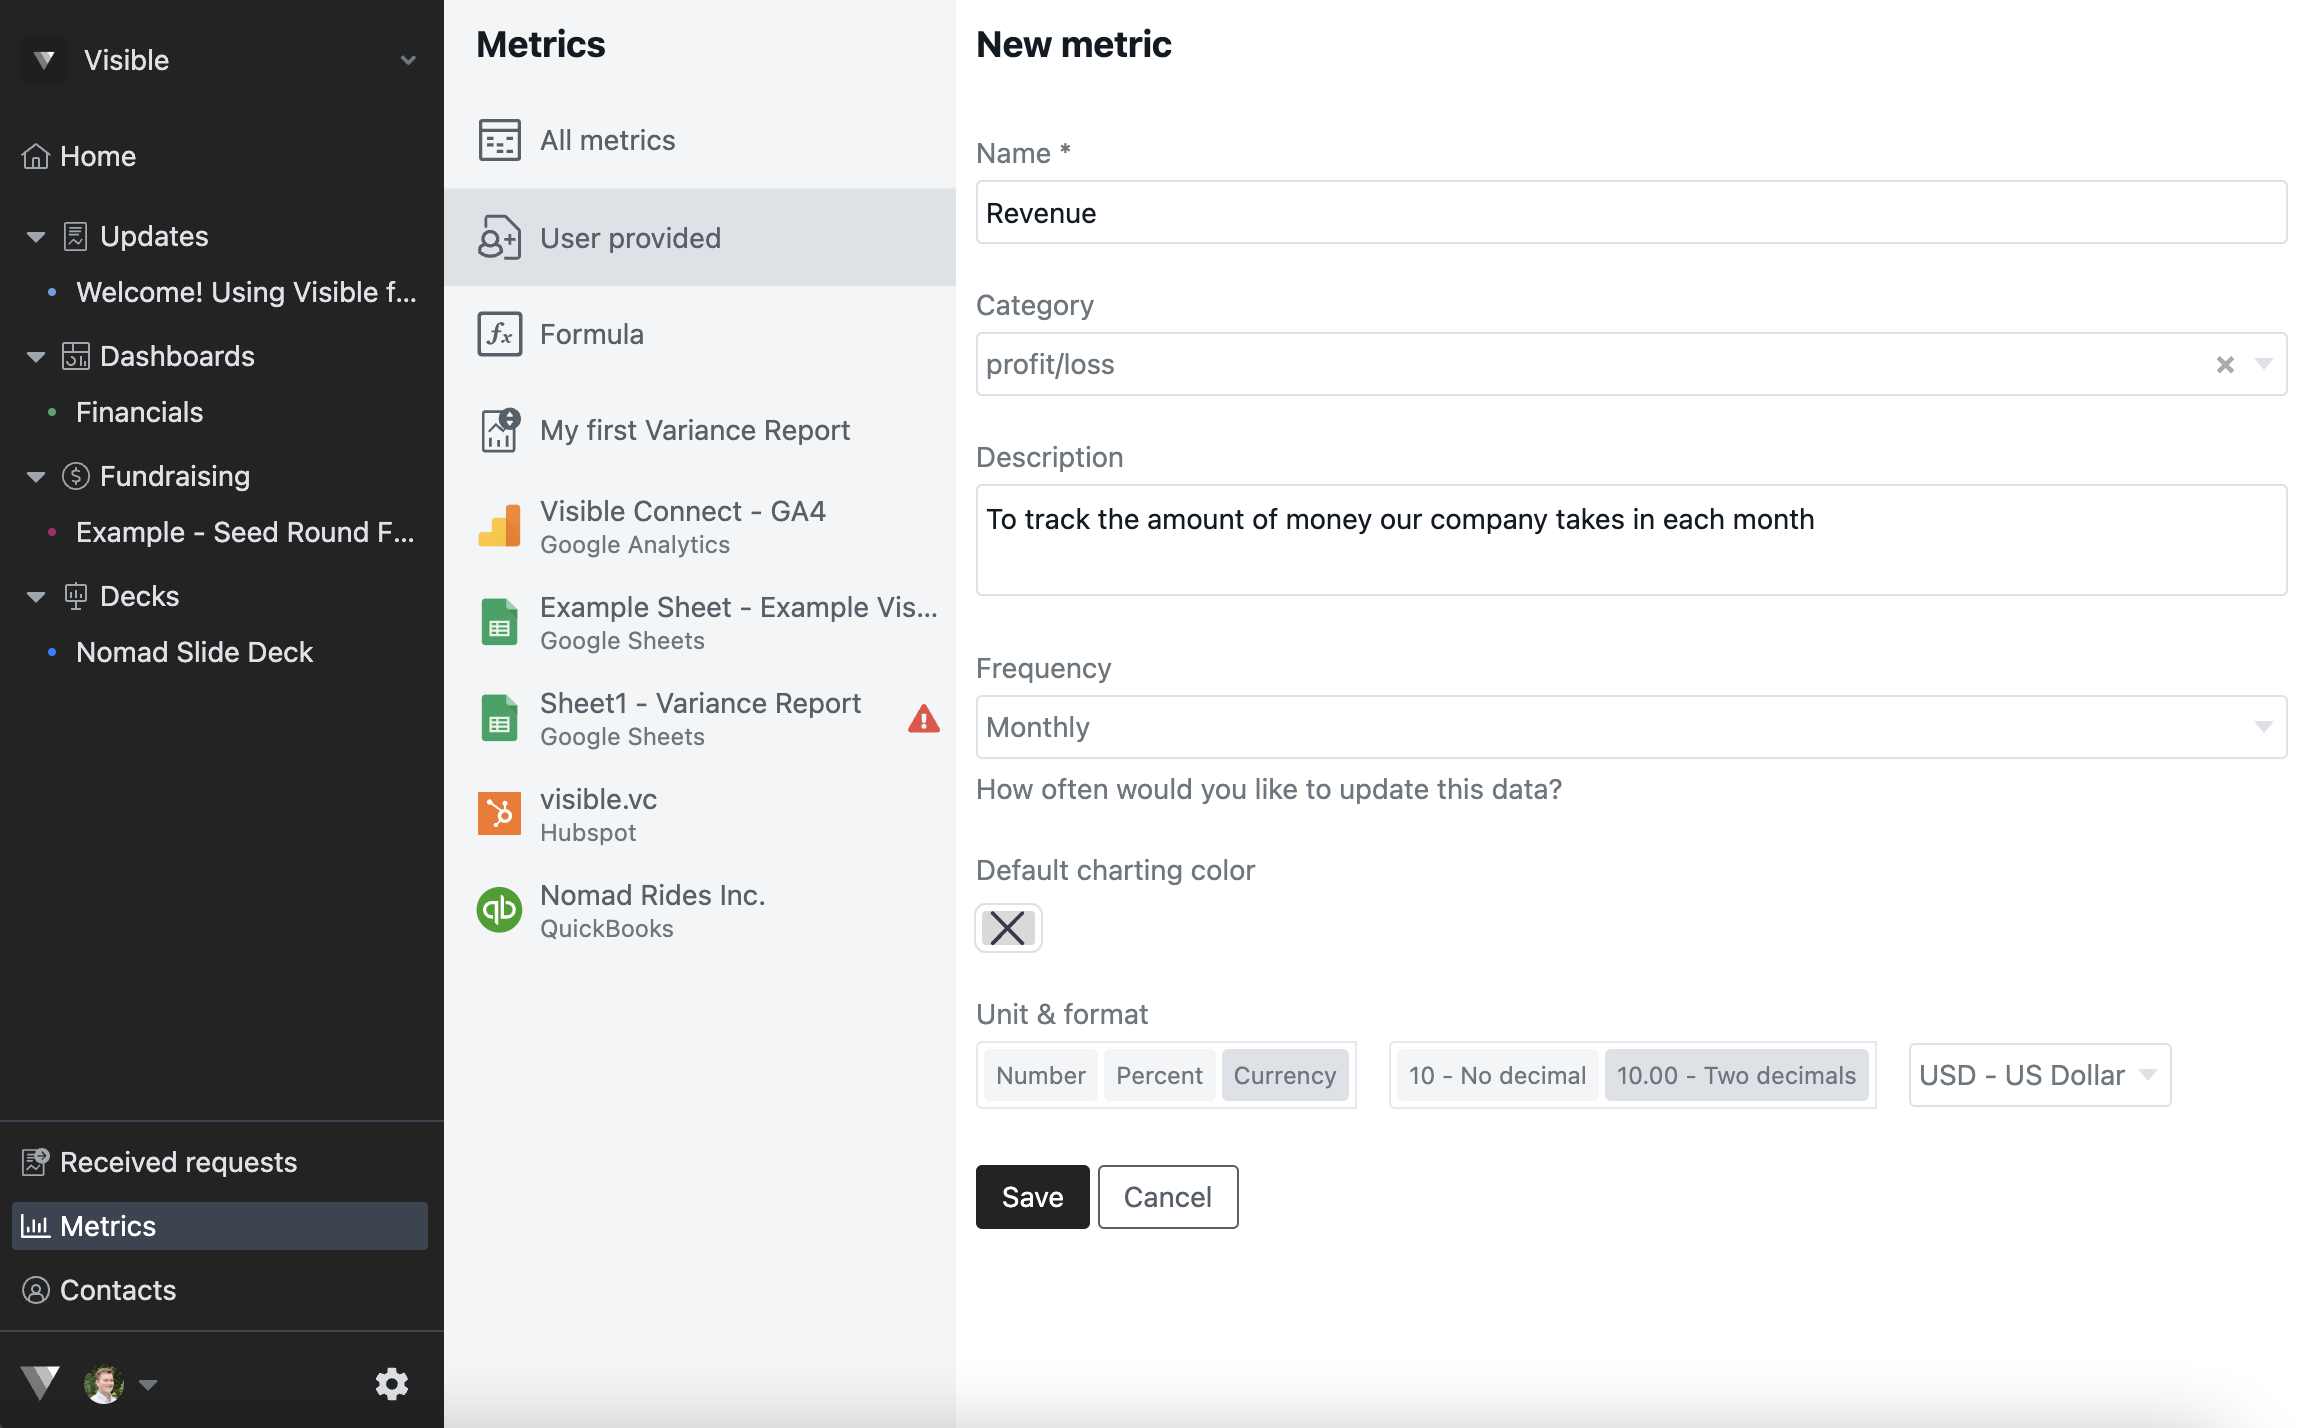
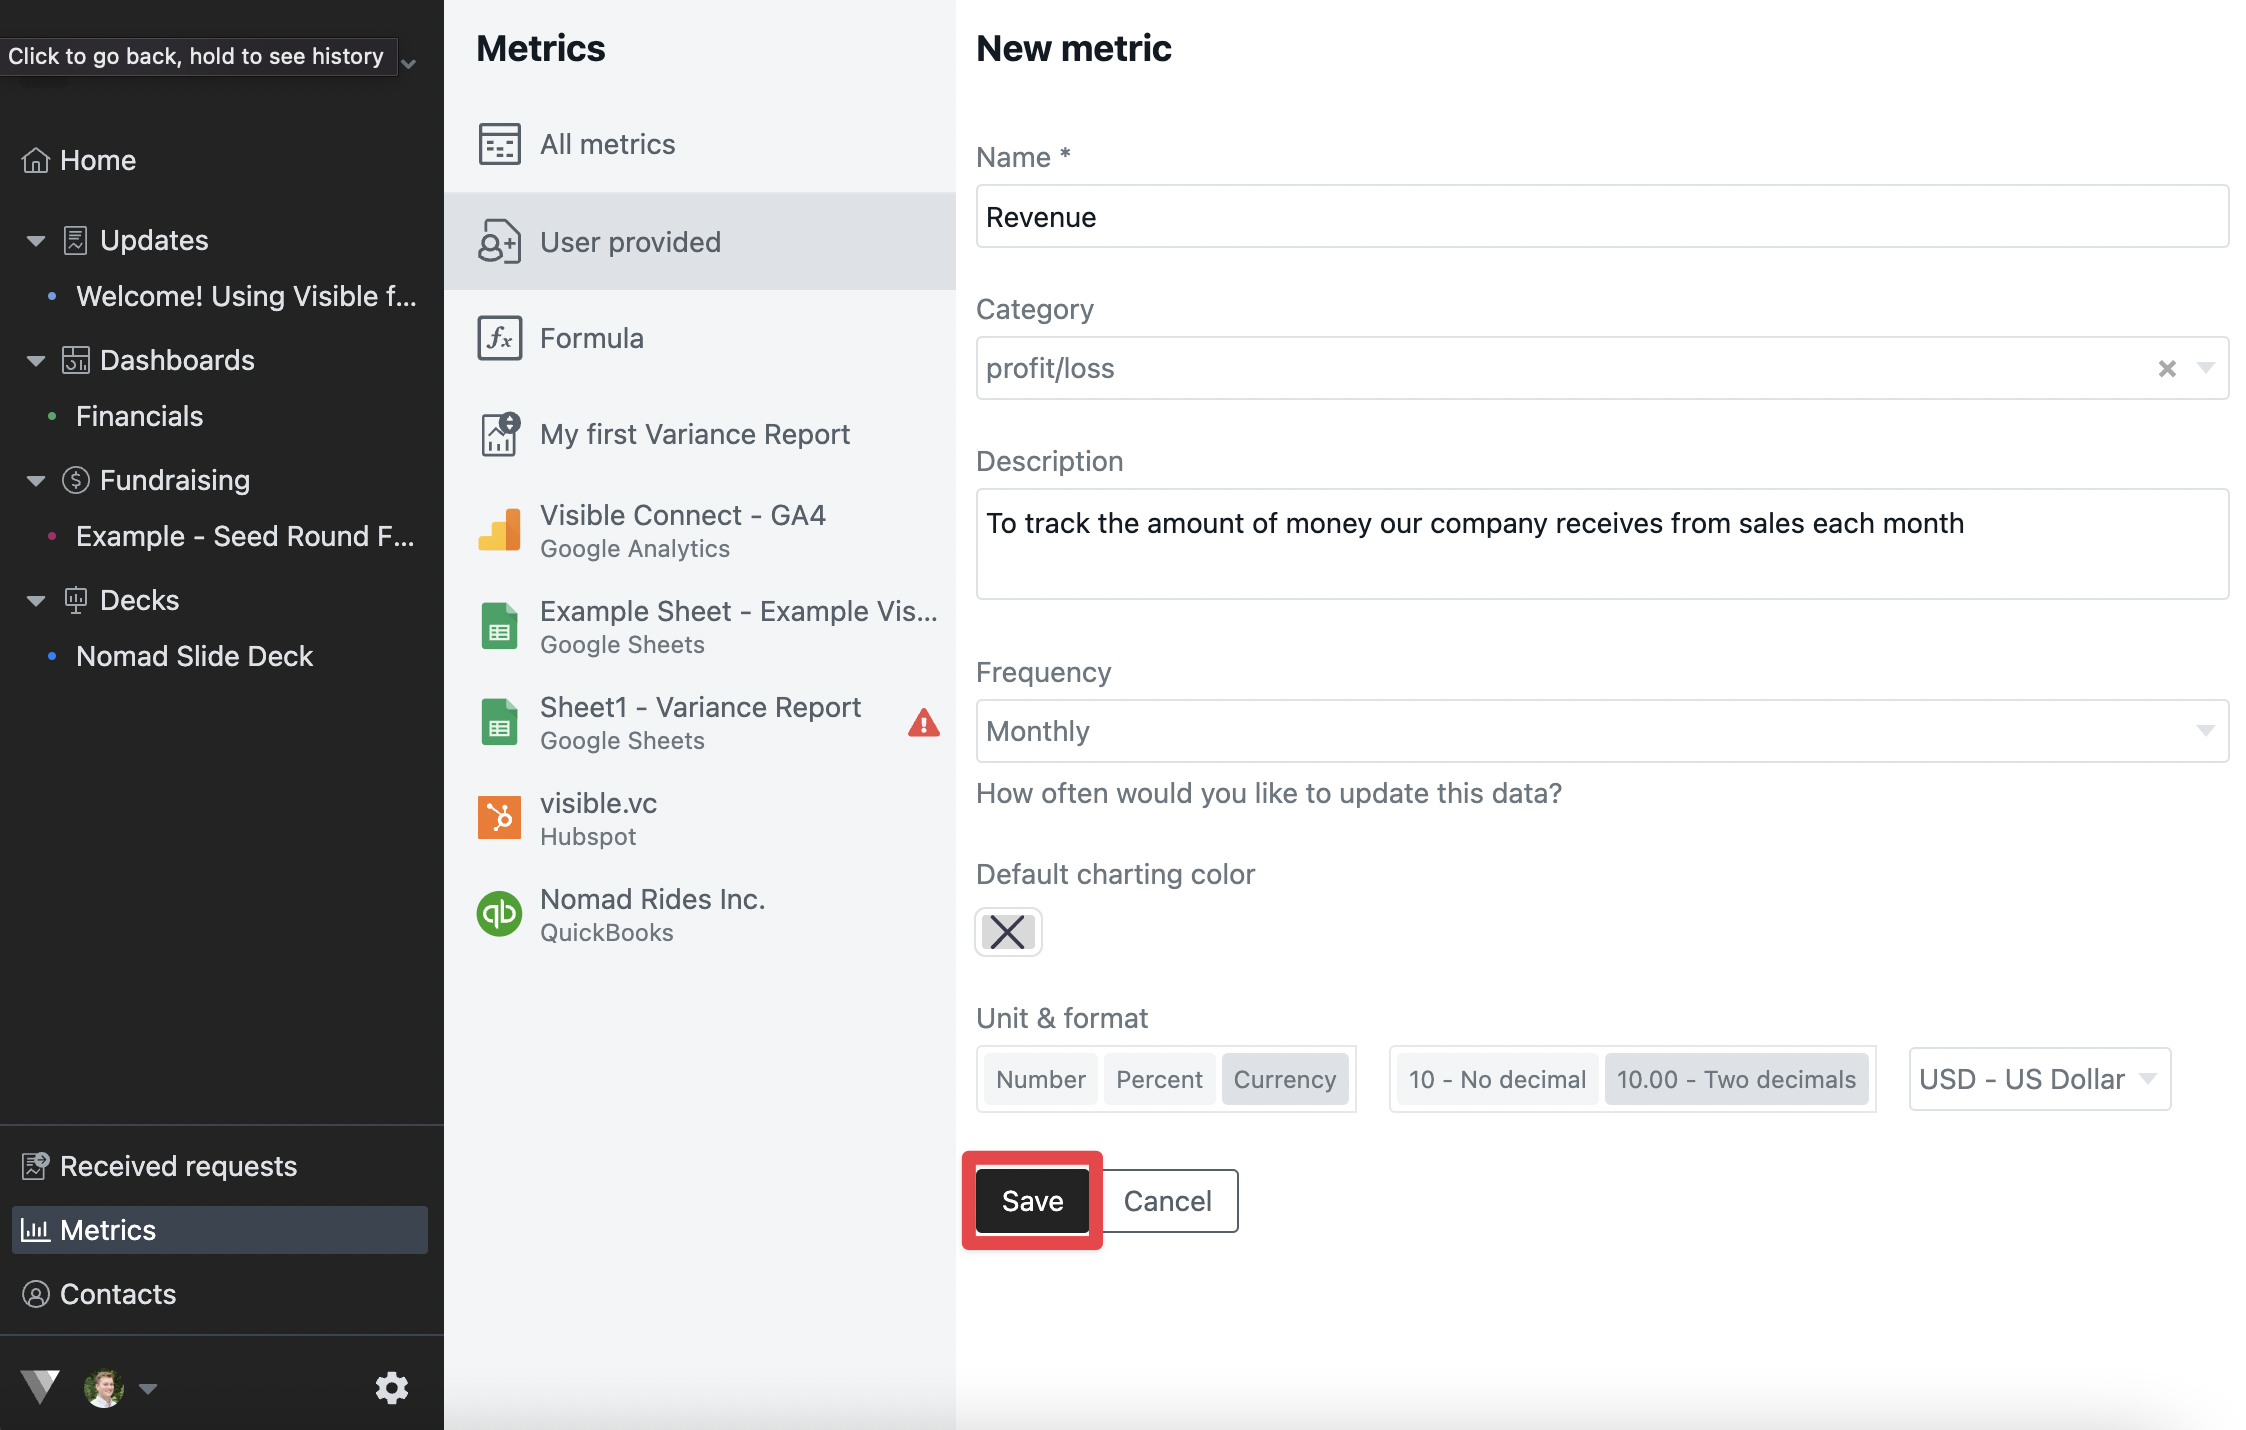
From here, you will be able to add a Name, Category, Description, Frequency, and Format of your metric! You will not be adding your actual data in this step. You will fill out the information for the aforementioned fields, then click Save.
From here, we recommend going back into your Metrics --> User provided to a view all the metrics you have added. Select the metrics you want to add data for and choose Edit data. This will provide you with a table view of your metrics. You can either enter data manually from here or copy and past rows of data from a google or excel sheet! From here you will be able to use User provided metrics as a source for building charts and tables on your dashboards
We hope this helps especially for those utilizing our Lite plan!
See screenshots below for step by step directions of this process
Open Visible and choose Metrics
Click User provided metrics

Click + New metric
Fill out desired information for your metric
Click Save
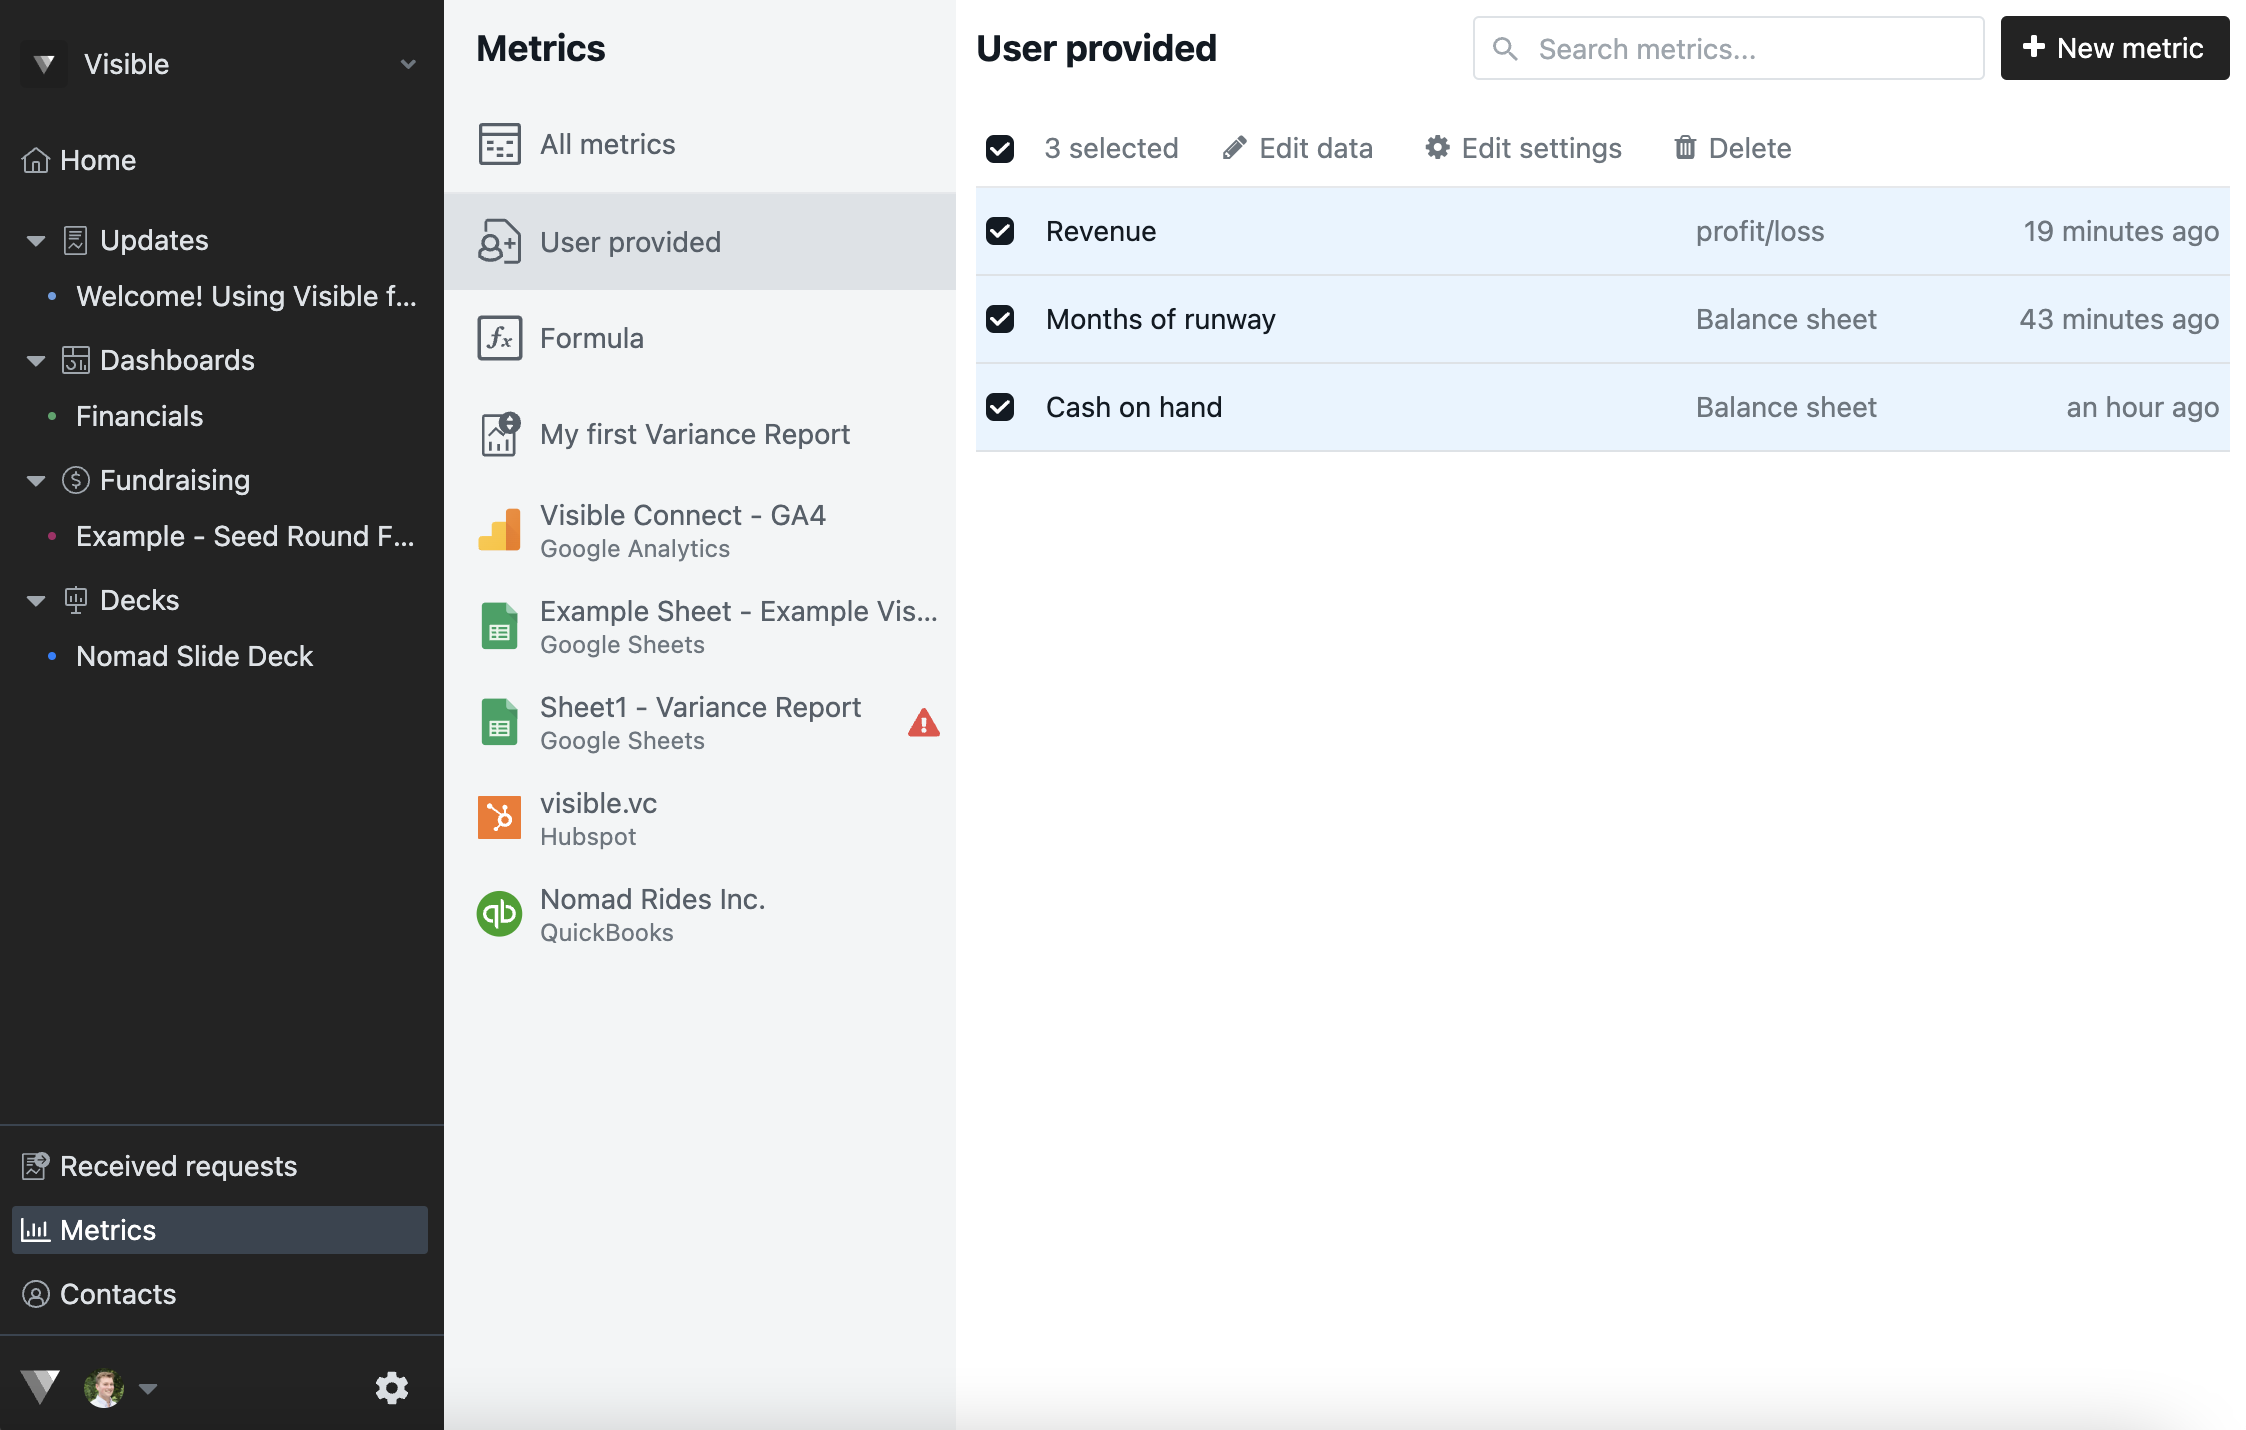
Go to User provided metrics again

Select the metrics for which you wish to add data
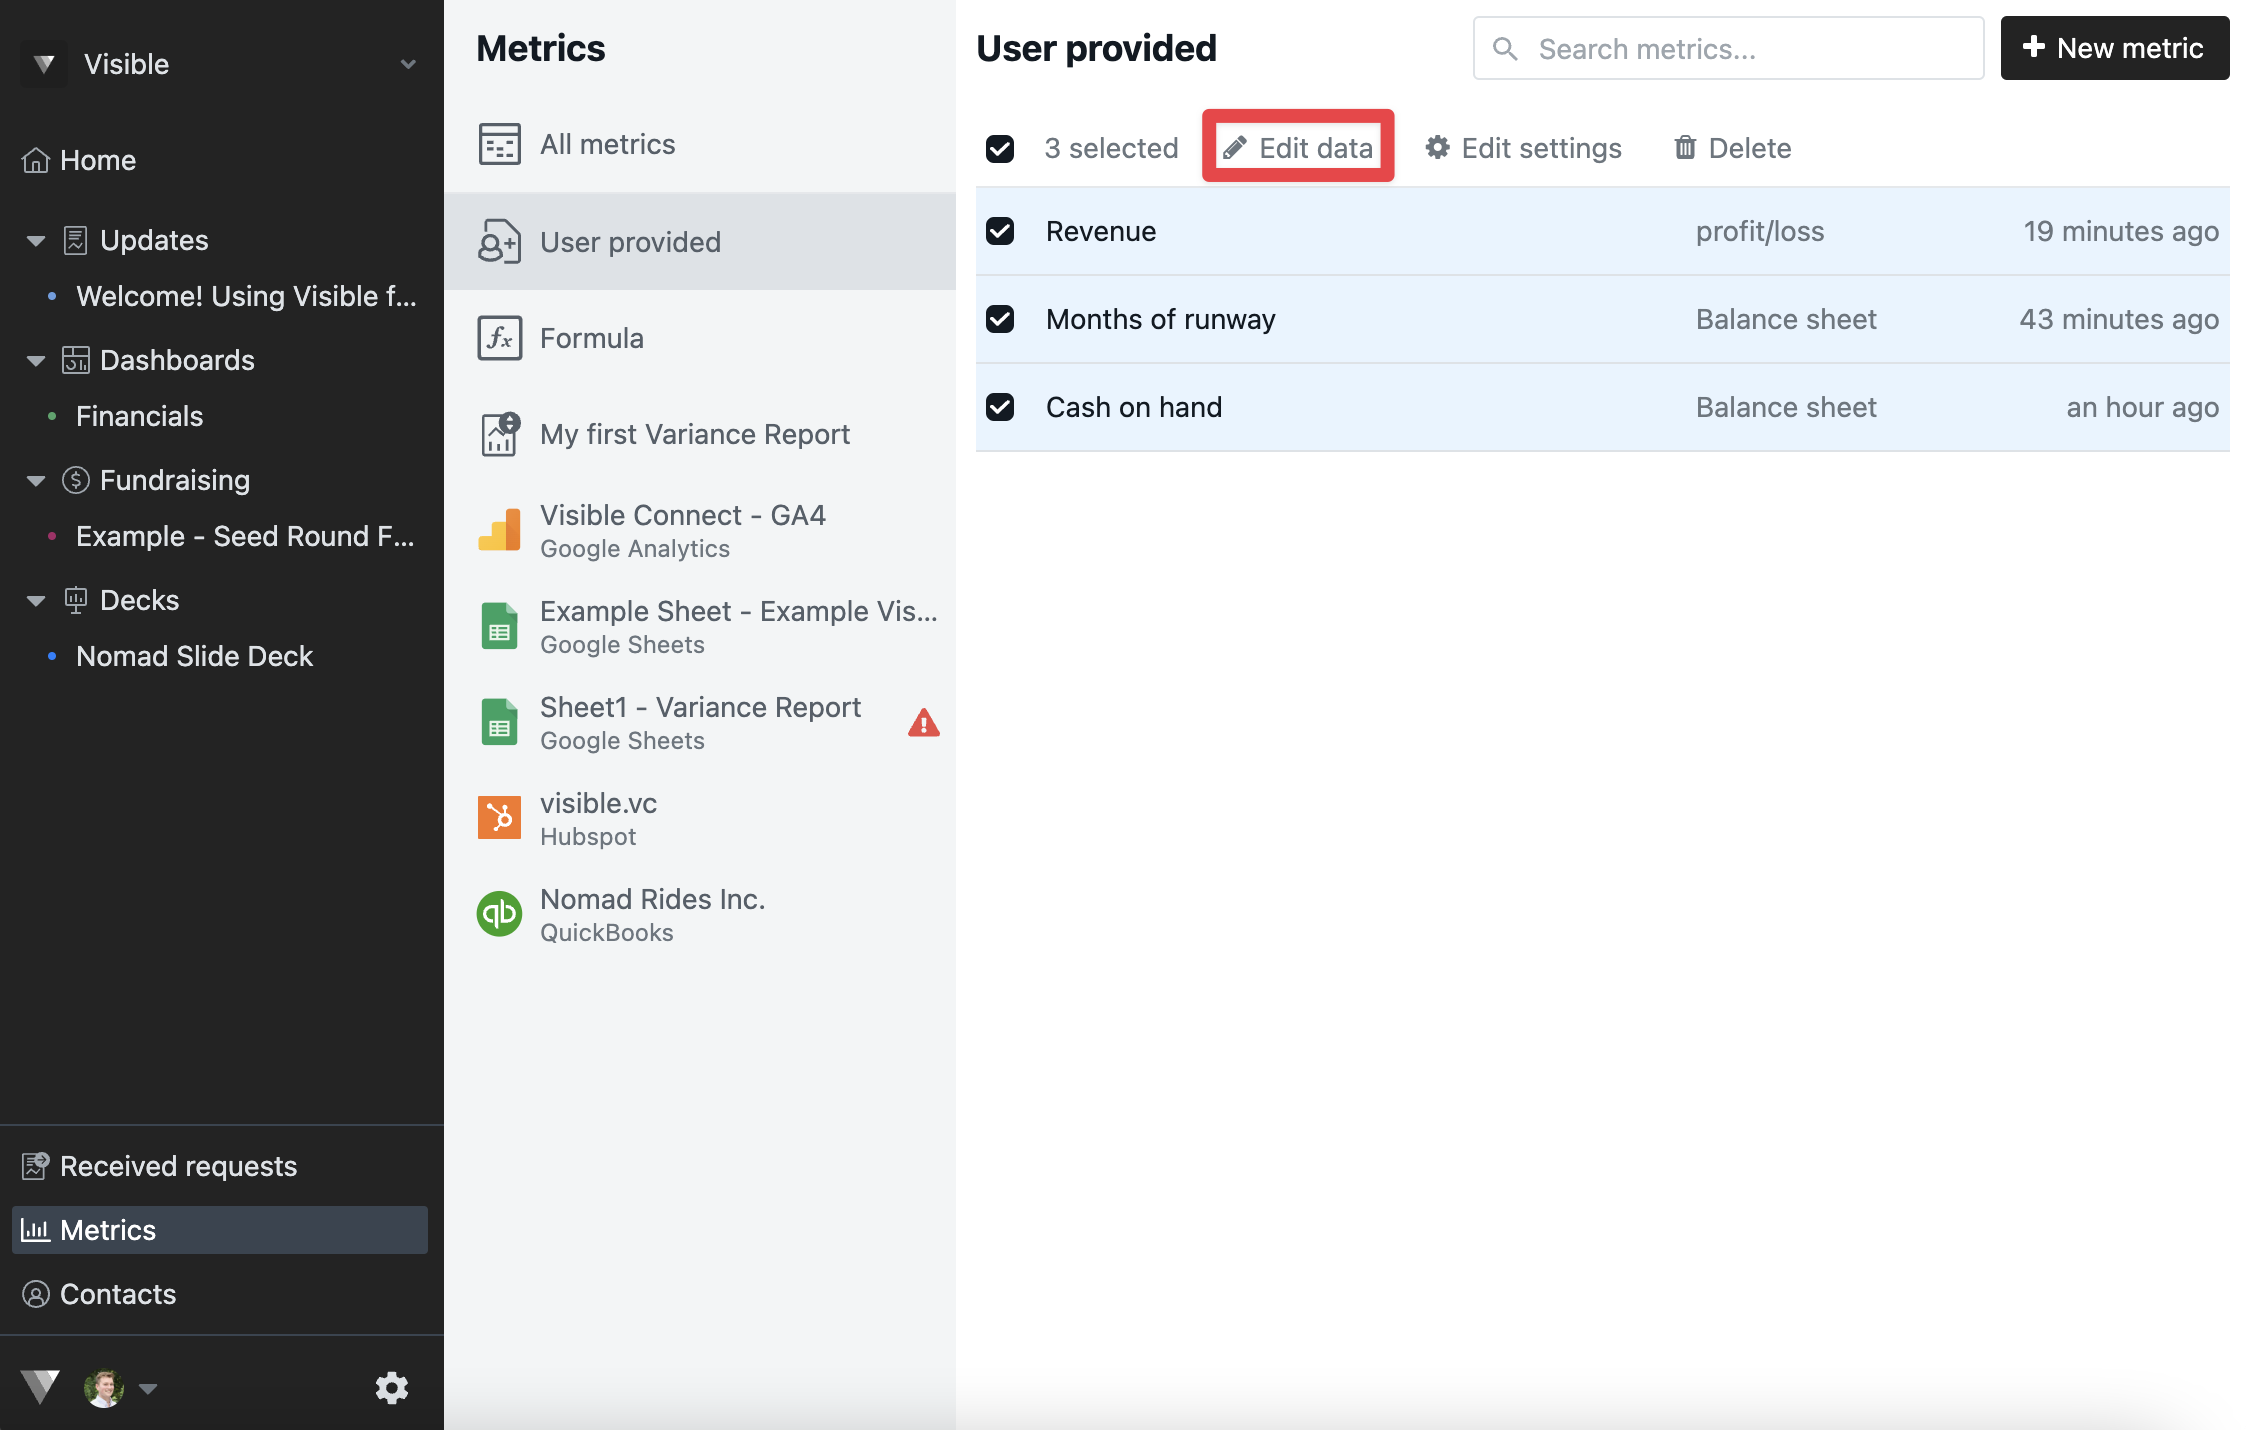
Click Edit data
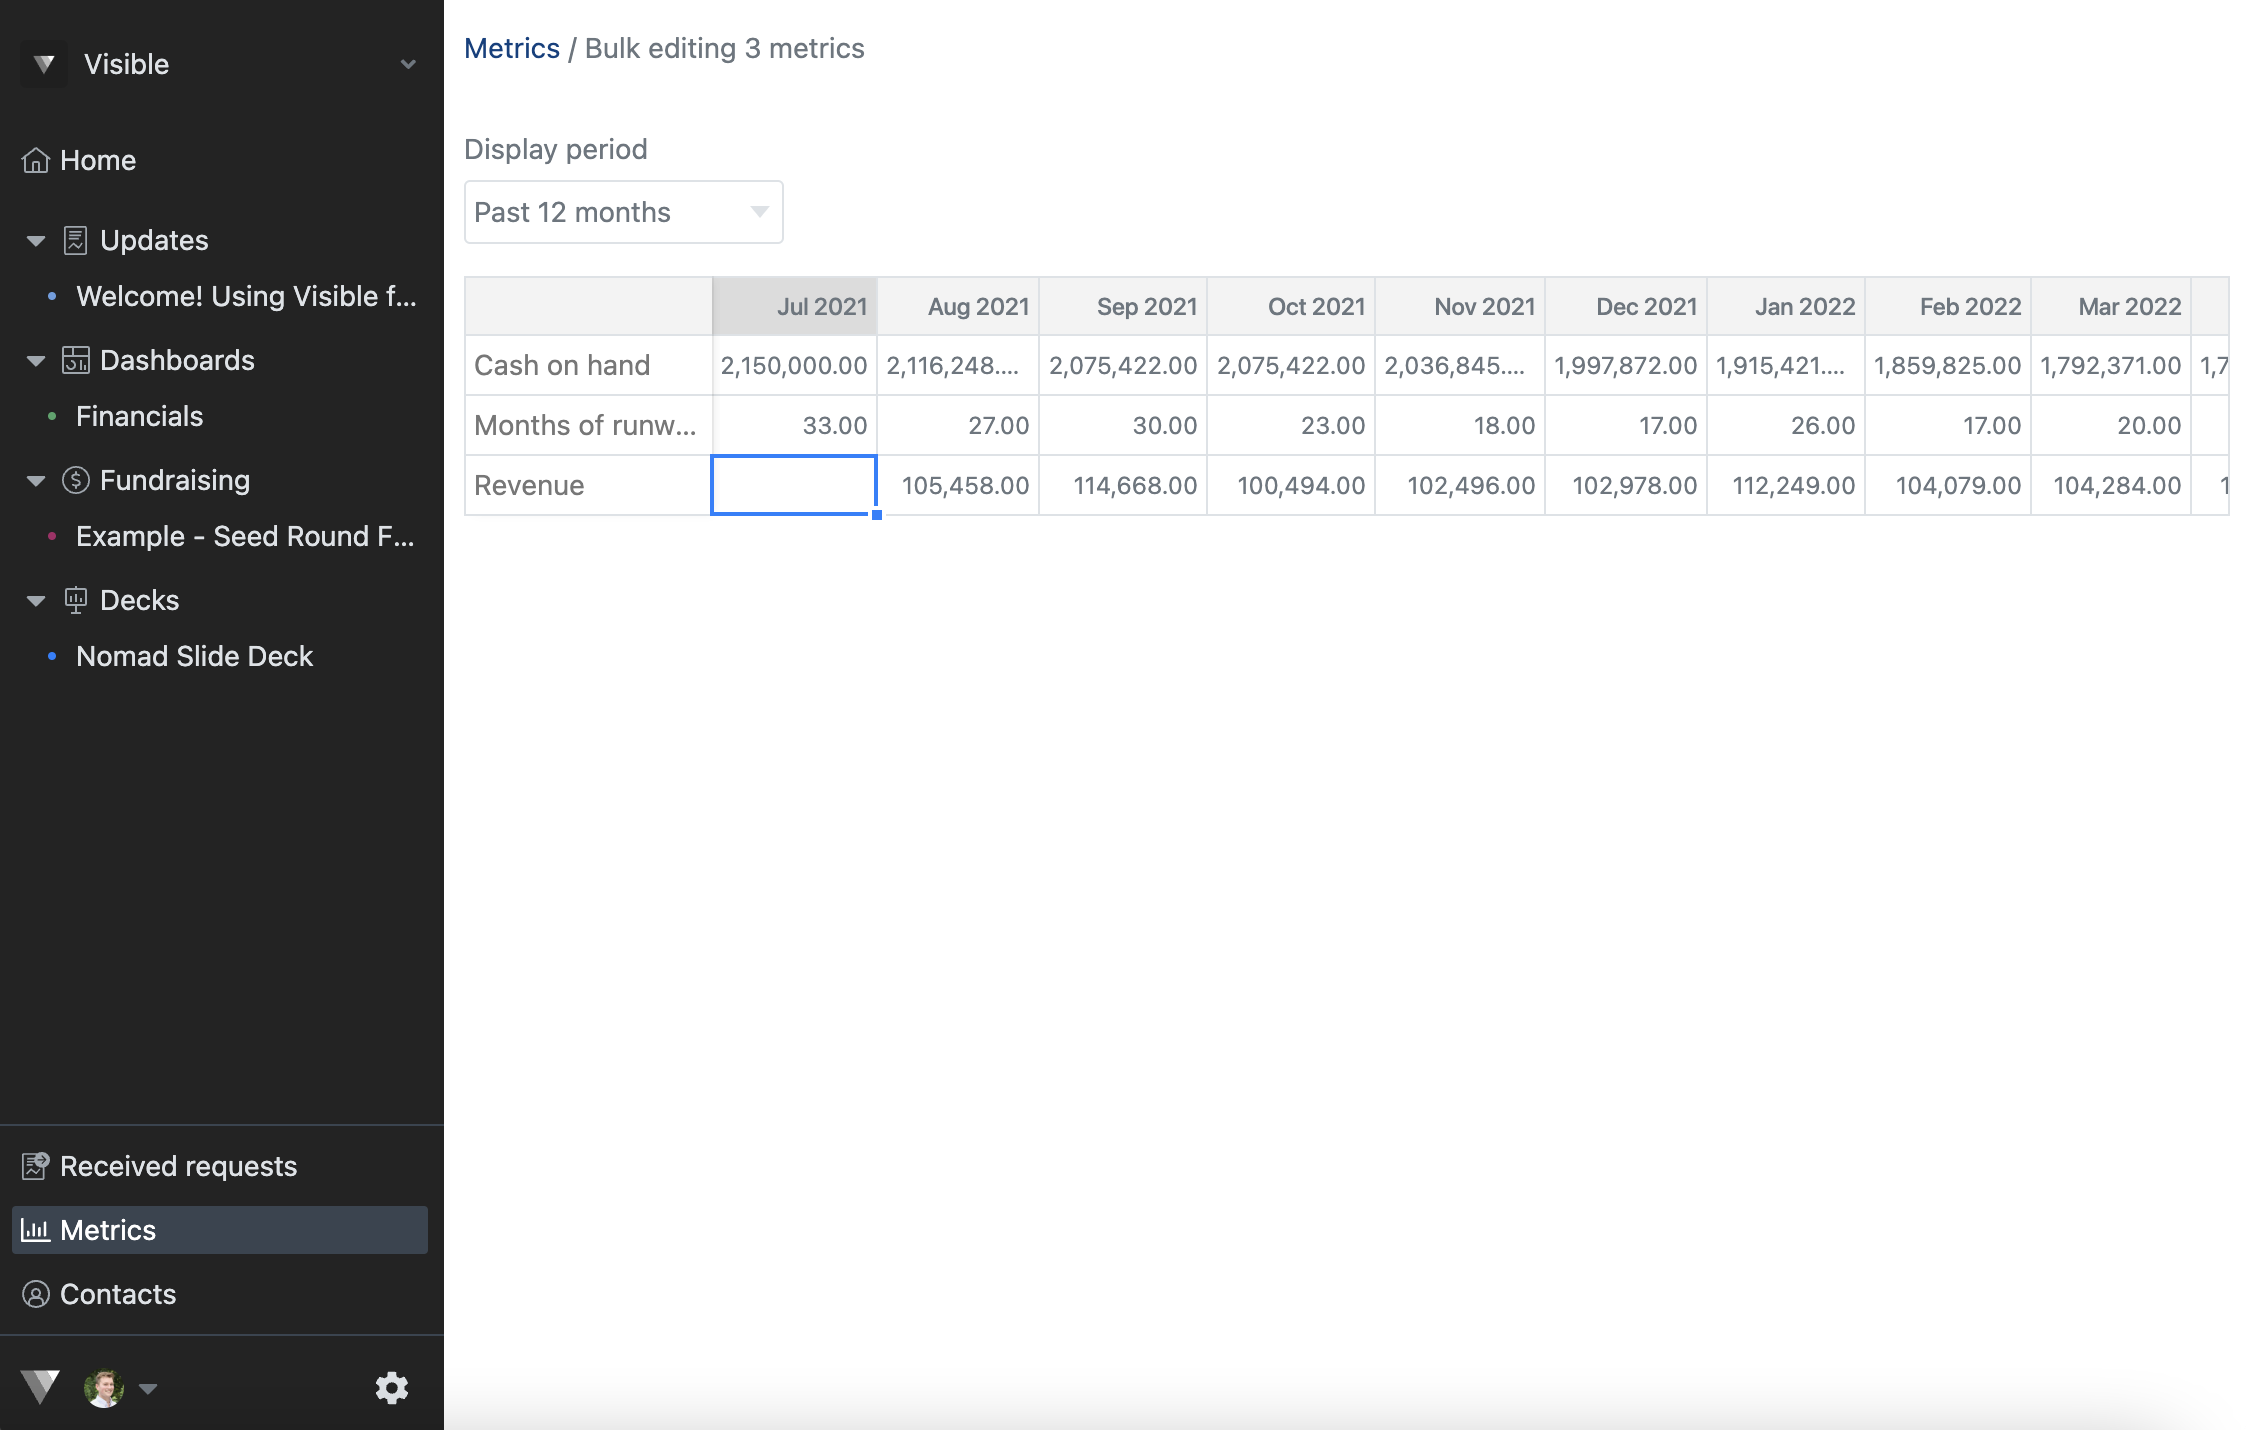
This will open a table view of your metrics. Copy and paste or manually add your numbers
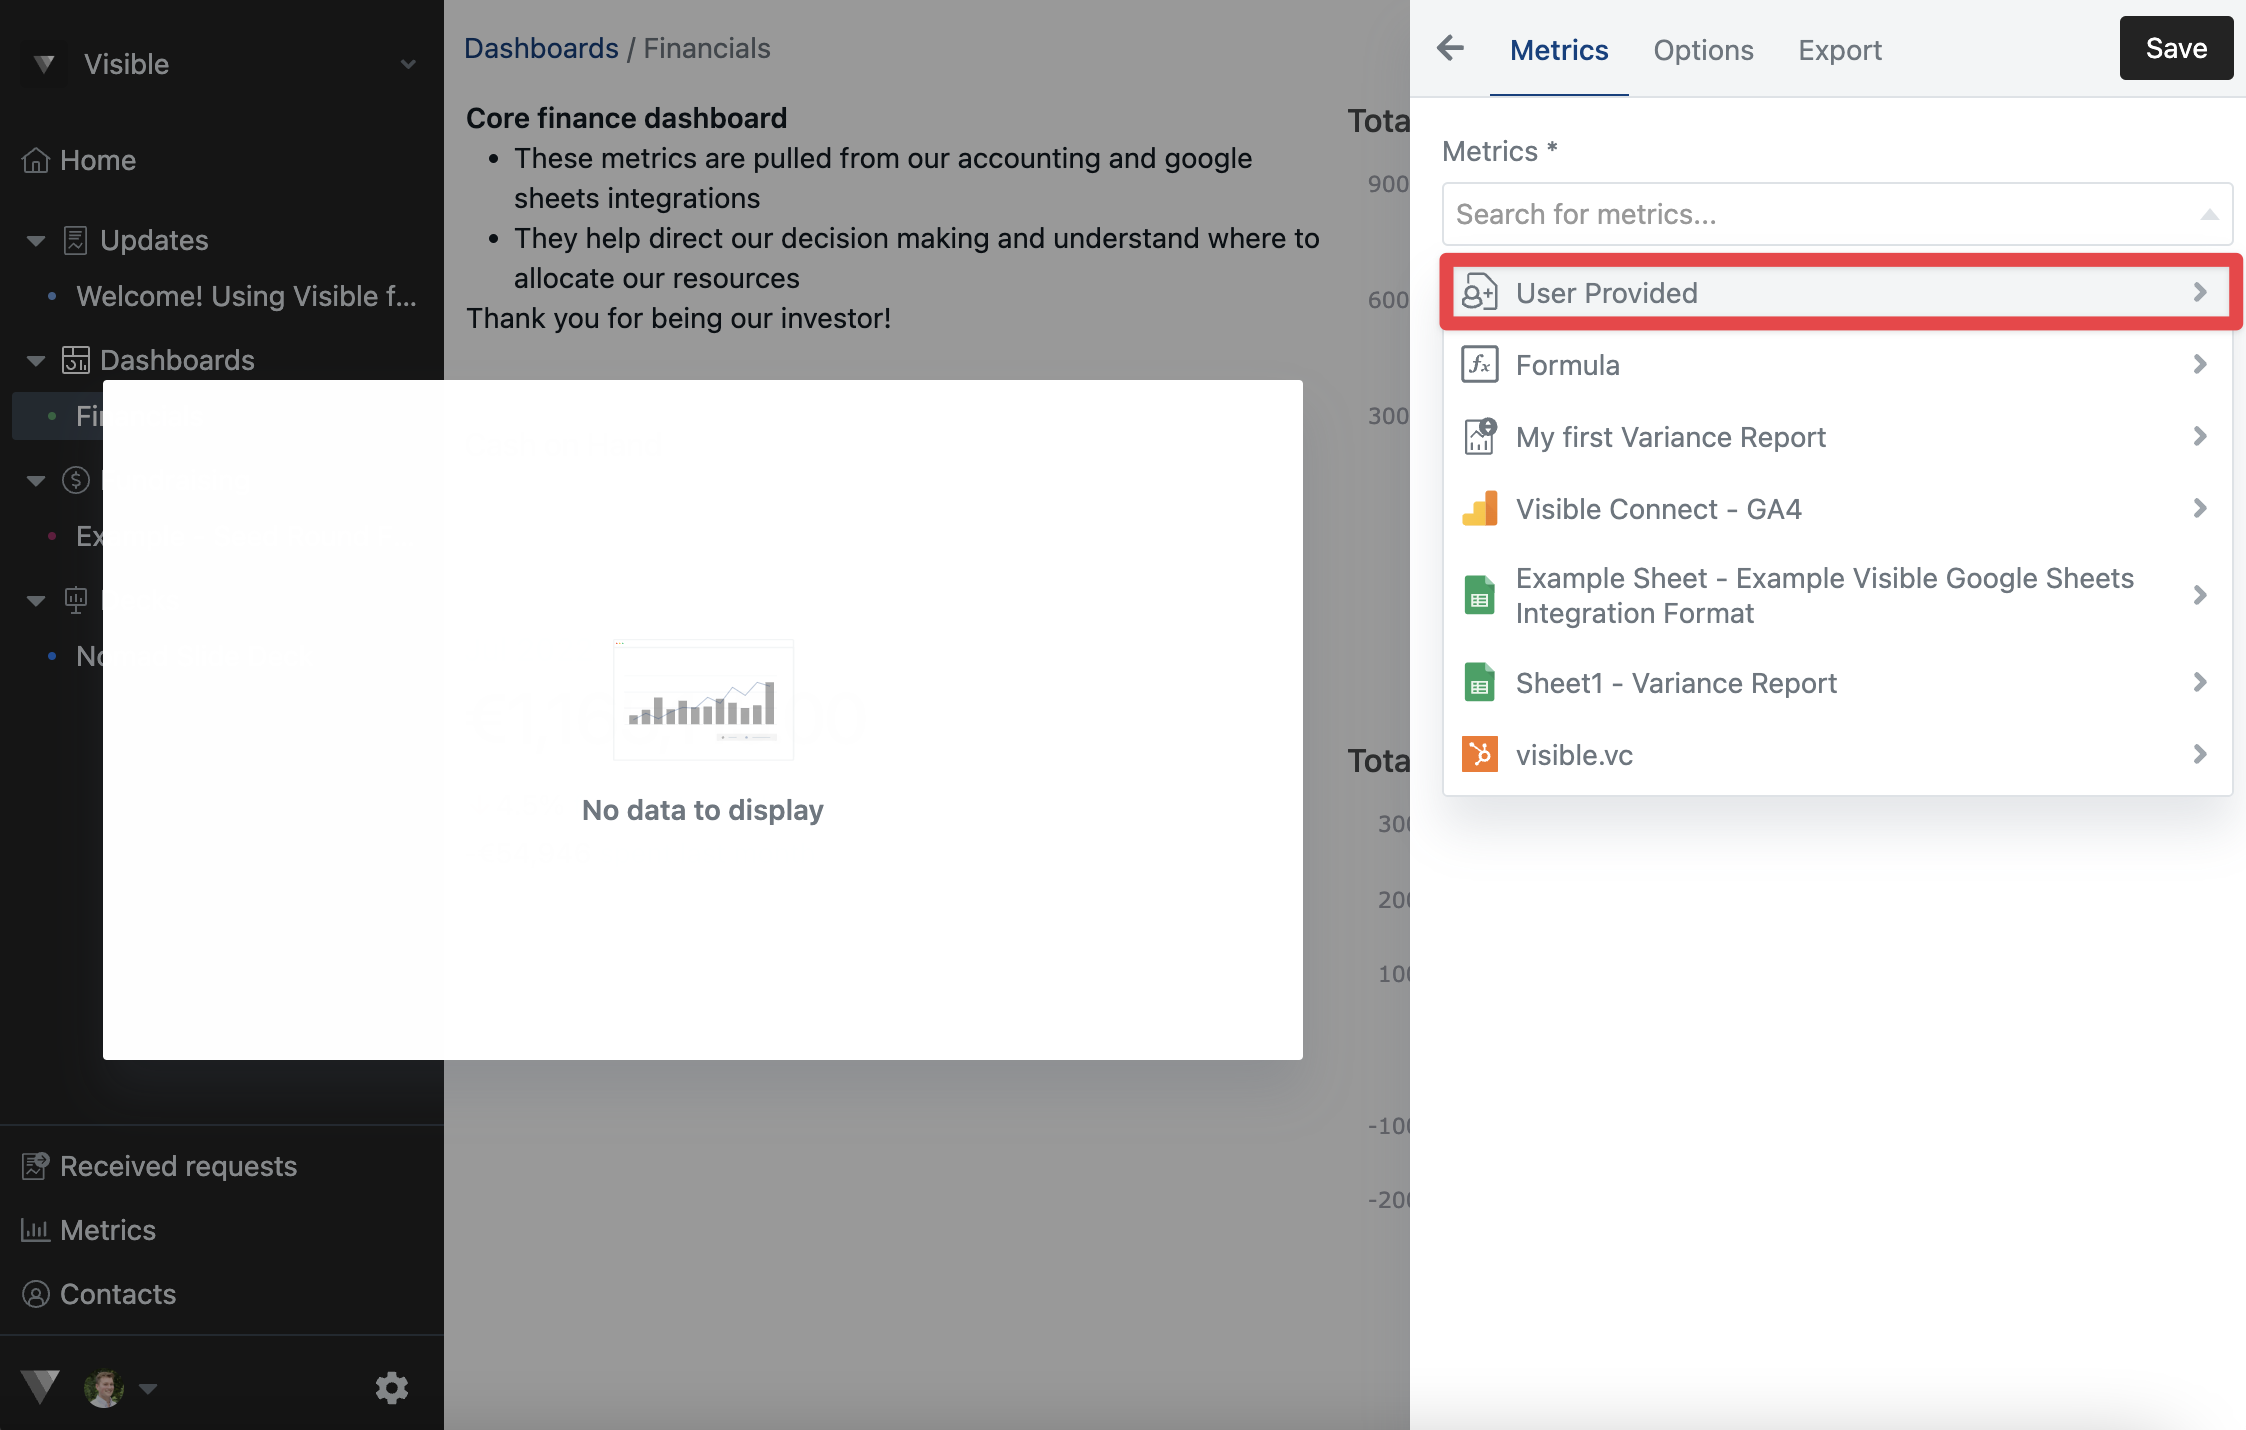
From here you will be able to utilize 'User provided' metrics when building a chart!
Please reach out if you any additional questions regarding user provided metrics. We hope this helps!