
This article will give you the steps on how to tailor your charts so they are only display for certain periods of time.
First you'll to open Visible and navigate to the dashboard where your chart lives. Click on the three horizontal dots in the top right of your chart and click Edit. This will open the chart builder. You will want to click on Options along the top of your chart builder.
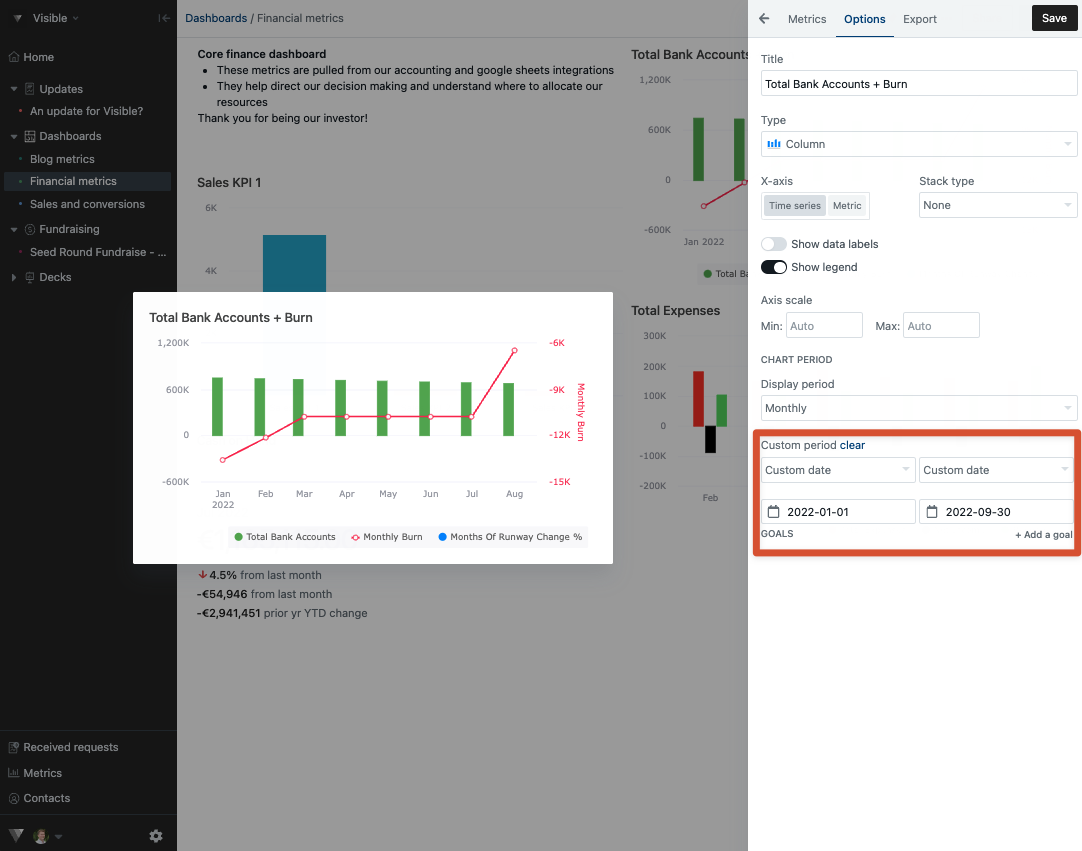
Towards the bottom you can enter custom periods for your chart. Enter the dates then click Save in the top right corner of your chart. this will save the chart to your dashboard. See screenshots of the process below!
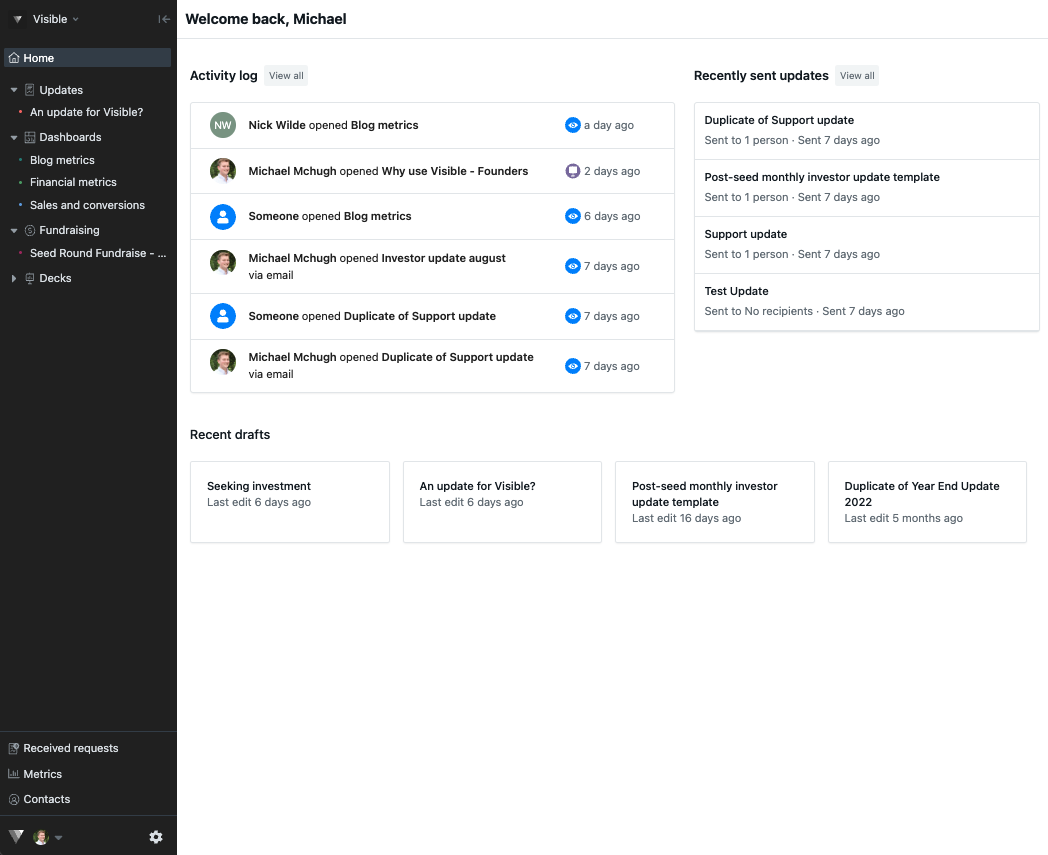
Open Visible
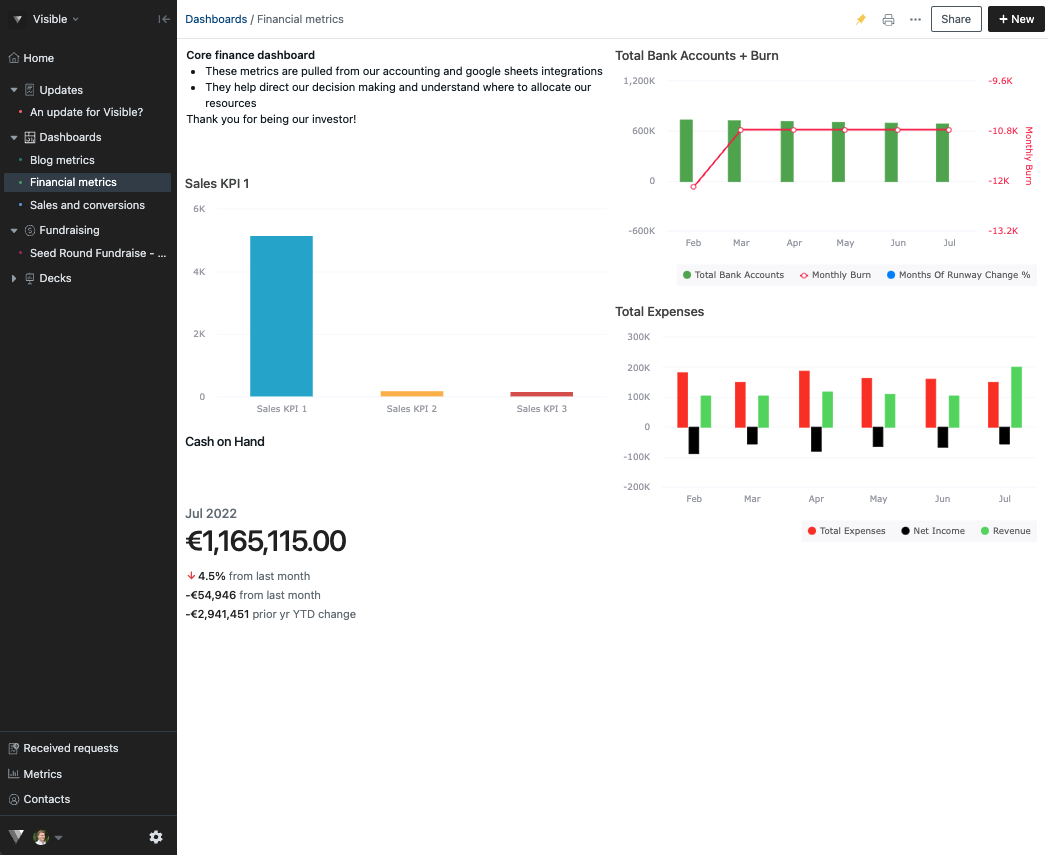
Open the dashboard of the chart you wish to customize
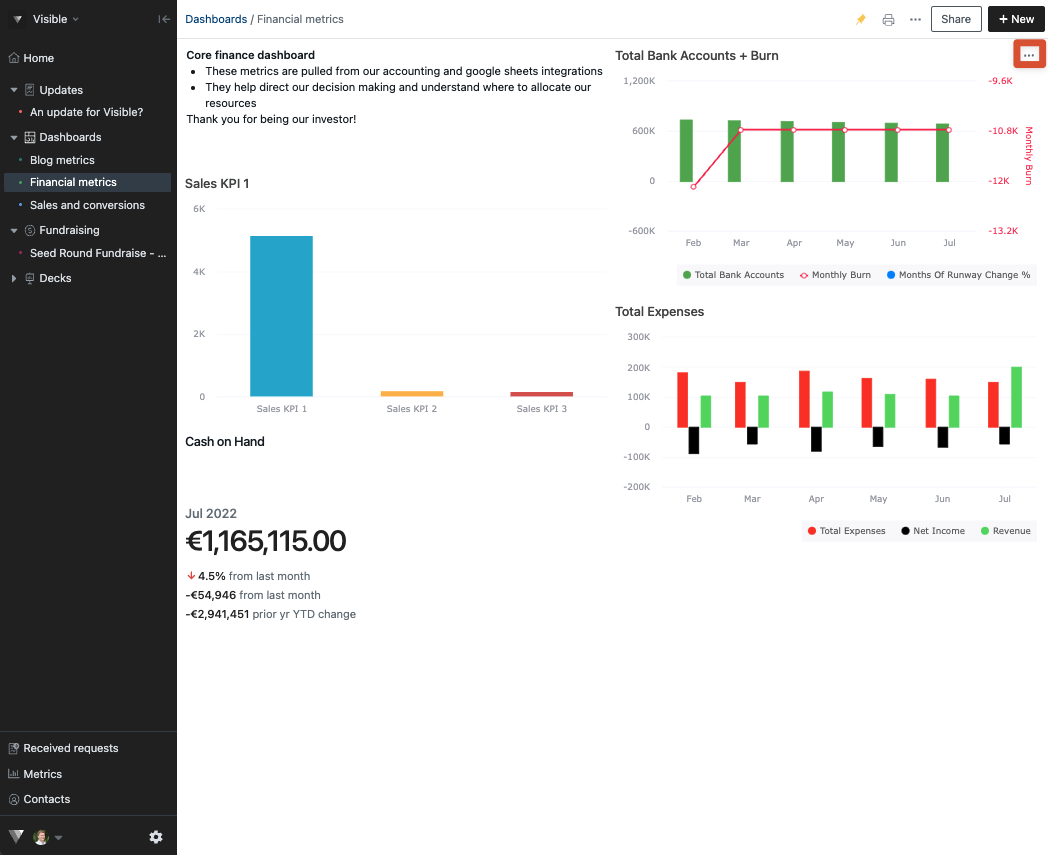
Click the three horizontal dots in the top right of the chart
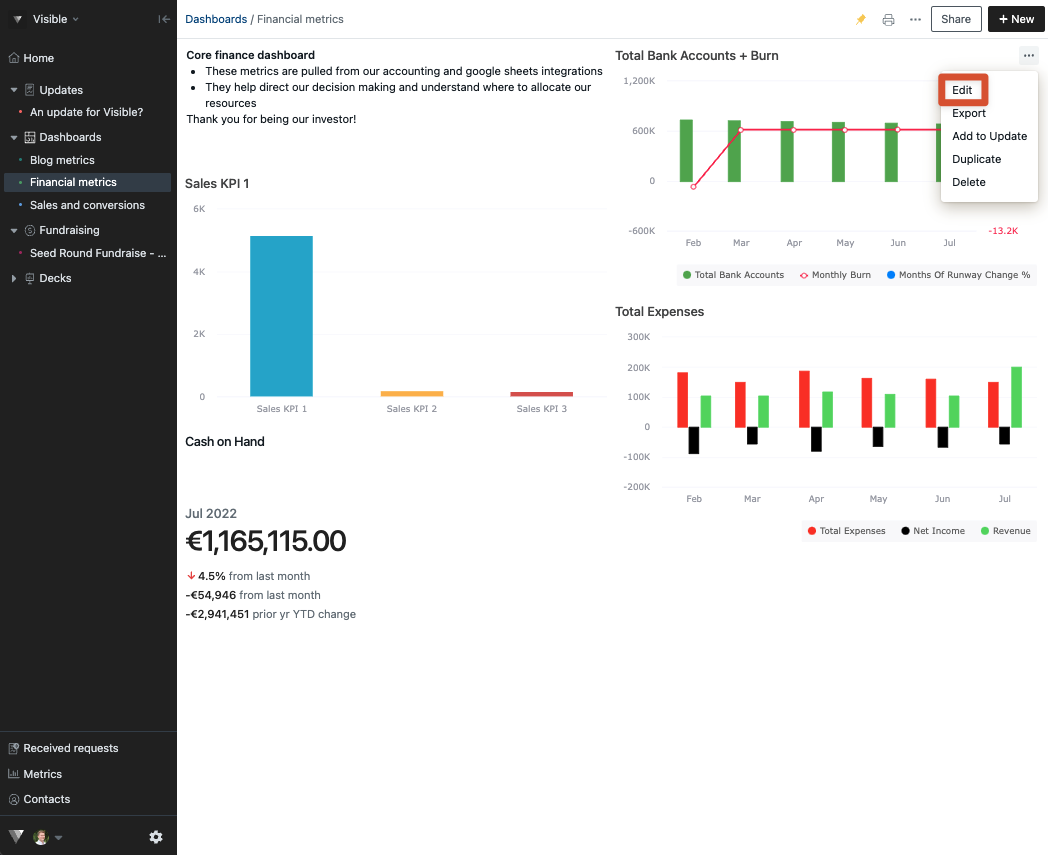
Click Edit
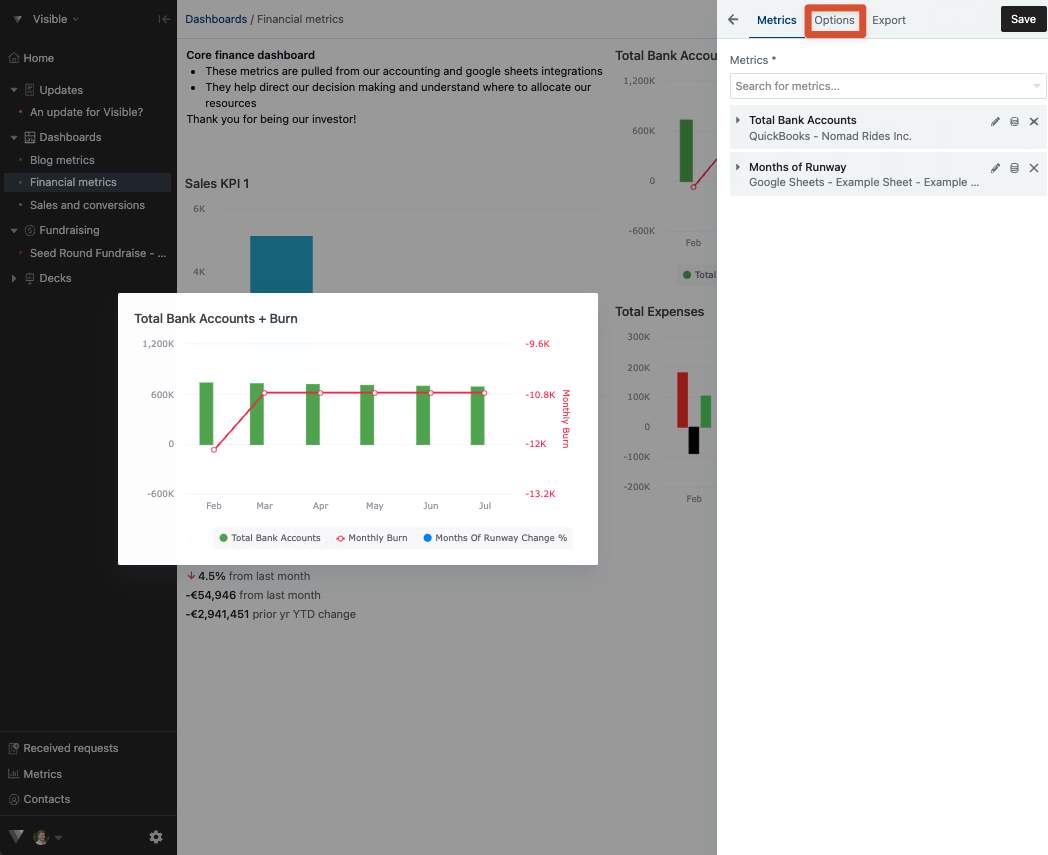
Click Options along the top of your chart builder
Choose Custom date for beginning and end dates. Set custom dates for the period of the chart
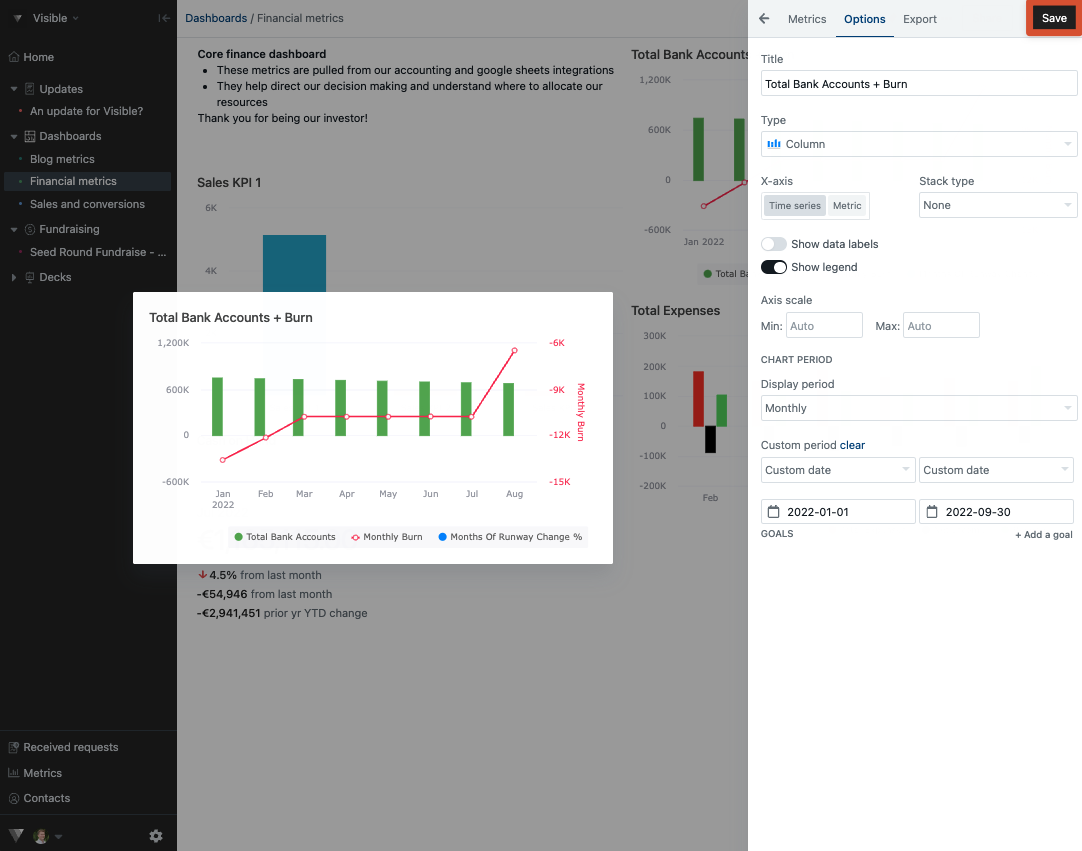
Click Save in the top right corner of your chart builder
Please let us know if you have any additional questions!