
This article should help you with how to edit an existing chart.
To edit an existing chart you will want to locate the respective chart on your dashboard or Update. From here you will want to click the three horizontal dots on the top right of the chart and click Edit as shown below:
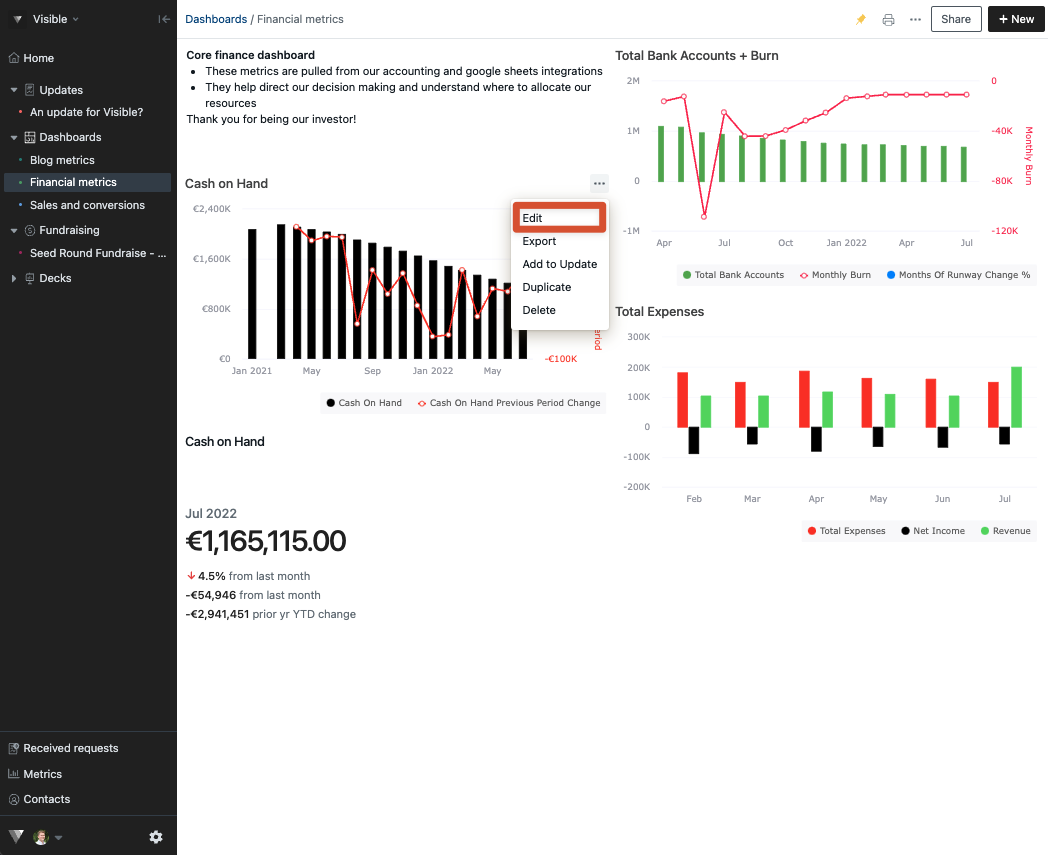
After you click Edit, the chart editor will appear on the right of your screen. You will automatically be directed to the Metrics section. This is where you can add additional metrics, change a metrics color, or add metric insight
You will also see Options and Export tabs across the top of the chart builder. The export tab allows you to simply export the chart.
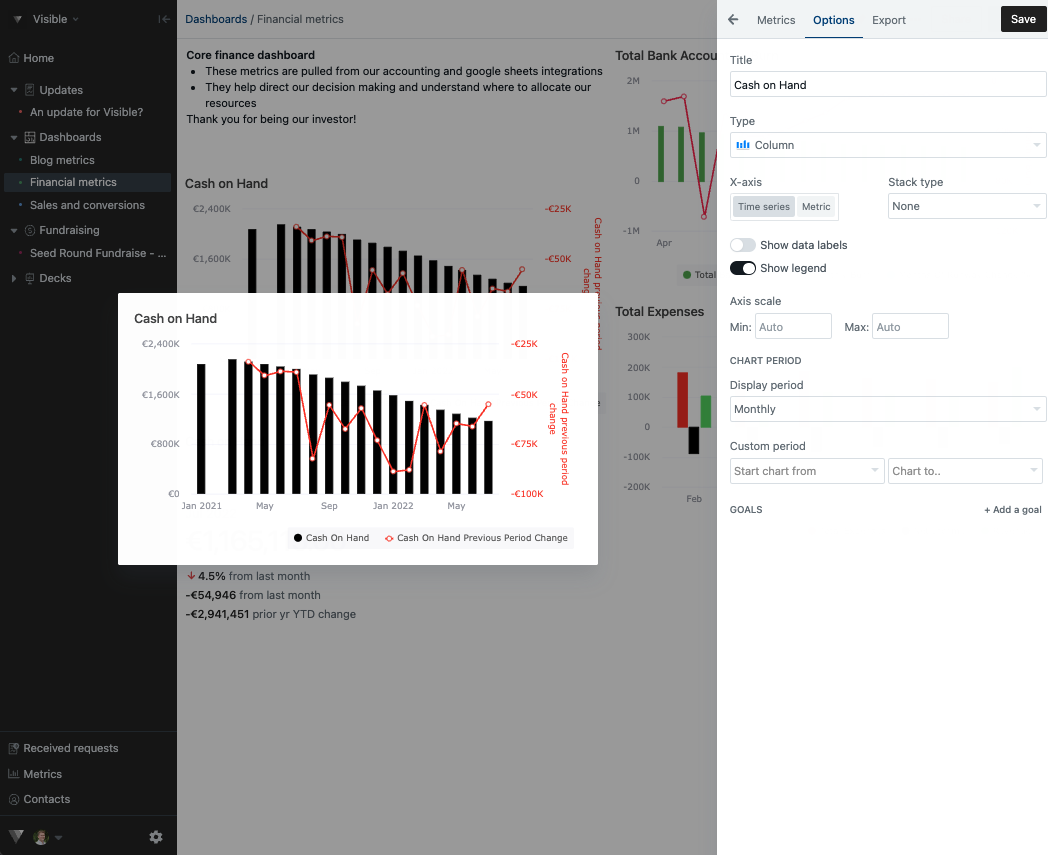
The Options tab (shown below) allows you to change the title of the chart, the chart type, stack type, display period, edit the display period, add a chart annotation, and add a goal to the chart.
The Export tab will allow you to export the chart as a .png, .svg, or. jpg. As well as set the dimensions of the export
Please let us know if you have any additional questions!