
Adding relevant context to your visualizations
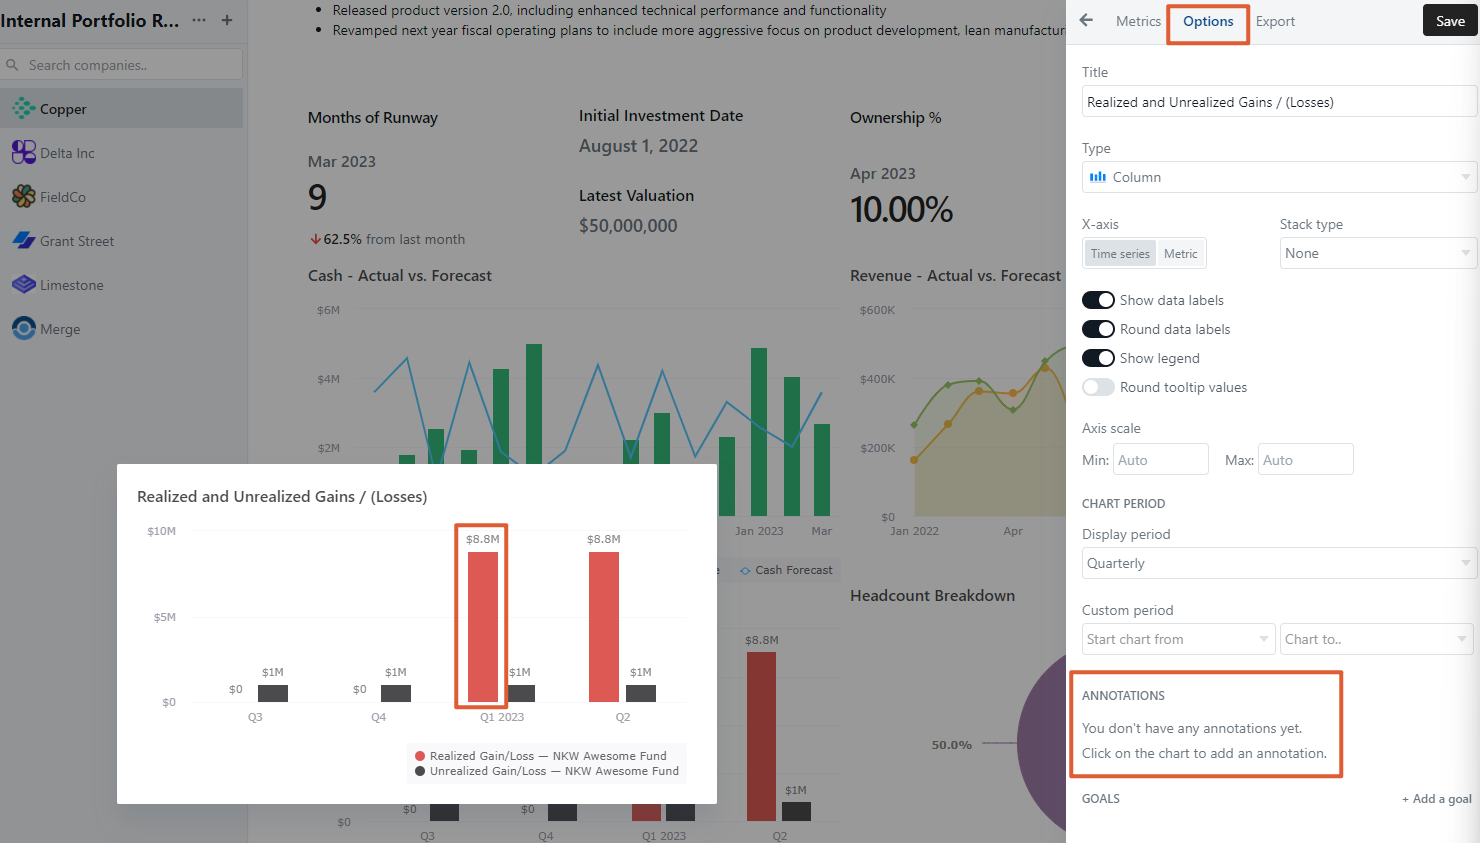
Visible makes it easy to annotate charts so you can provide relevant context to viewers. To add an annotation to a chart, open the chart and toggle to options in the top pane.
In the bottom right of your screen, you'll see a summary of annotations. To create a new annotation, click anywhere on the data in the chart.
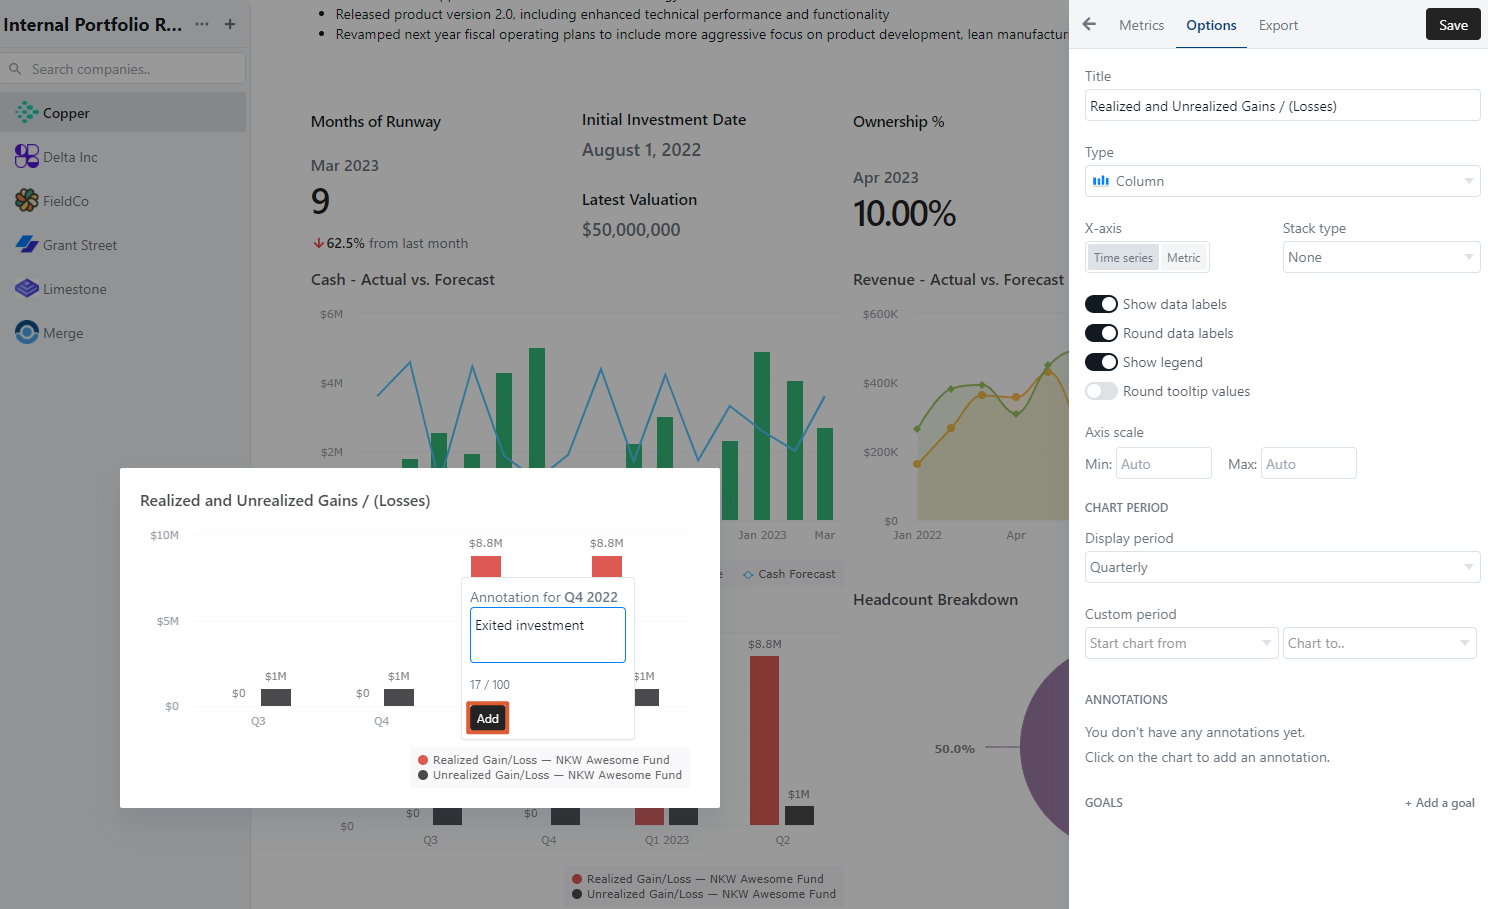
Add your content to the text box. Click add when done.
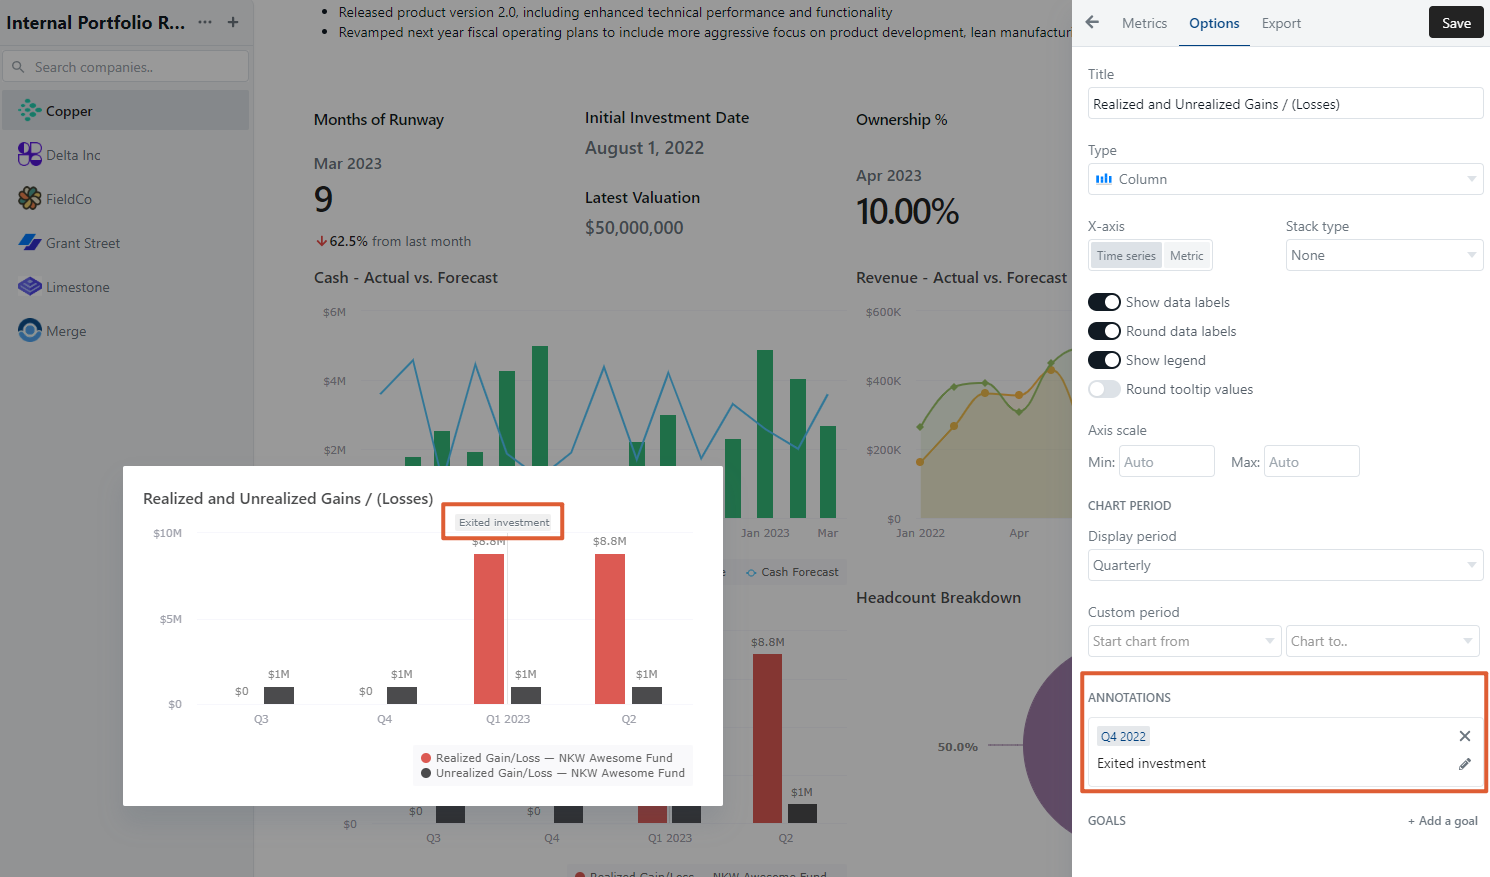
You'll now see the annotation in the chart as well as in the annotations section of the chart builder.
Please let us know if you have additional questions!