
This article will help you set a custom axis scale on your chart
To customize your chart, you can set a custom min and max range for your chart. This will make the y-axis customized to the limits you set. You can edit your chart by going into your chart editor and setting a custom Axis scale.
To do this, open your dashboard. Click on the three dots in the top right of your chart and click Edit. Within your chart editor, click Options along the top of your chart editor. Set the Min and Max ranges for your Axis scale and click Save in the top right. From here, your chart will be saved with your custom Axis scale. This should help when you are toggling on to chart a metric on a separate y-axis.
See screenshots of this below
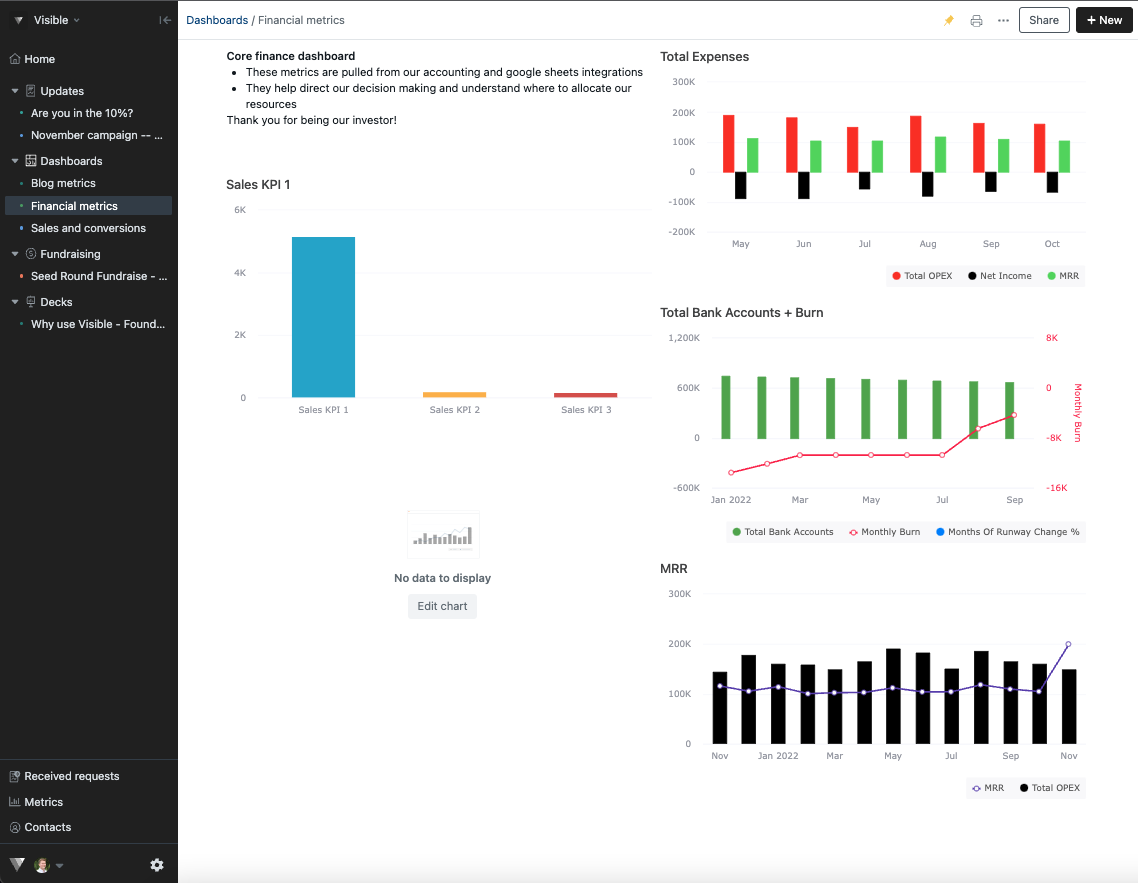
Open your dashboard
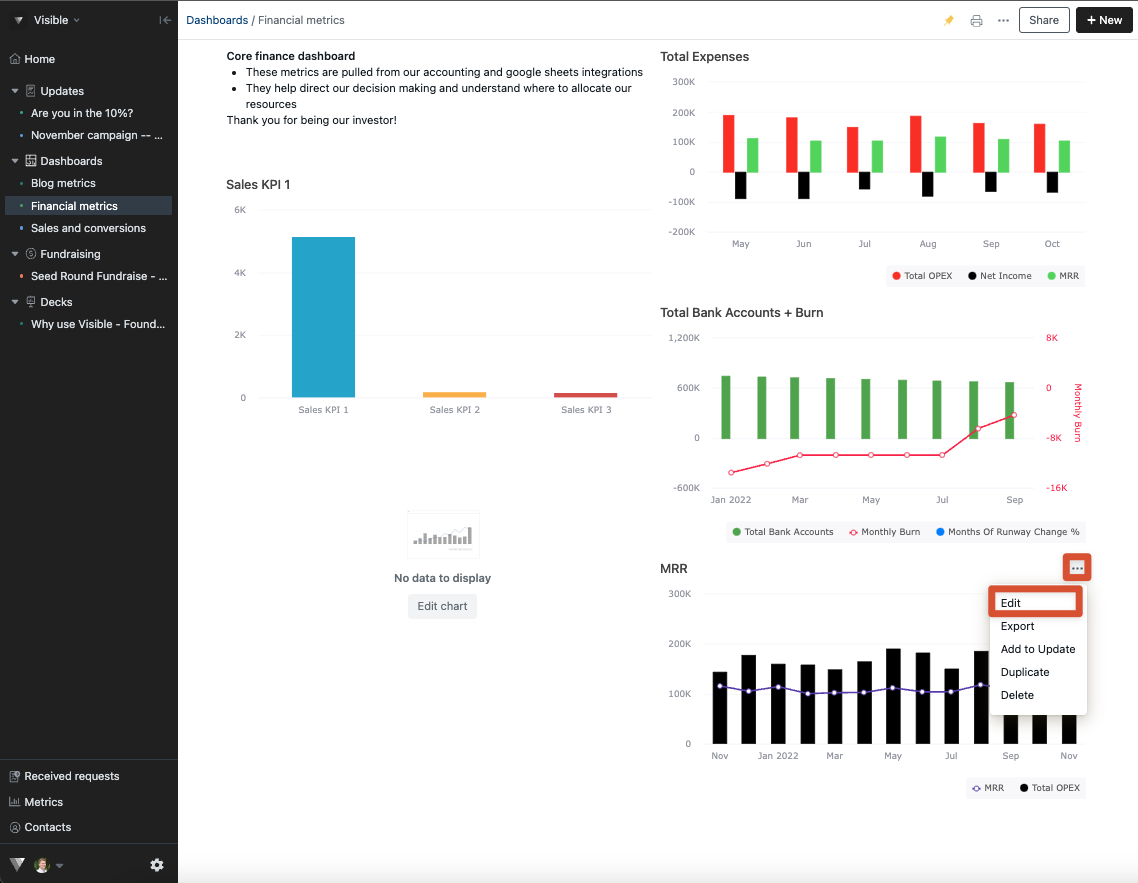
Click the three dots in the top right of your chart and click Edit
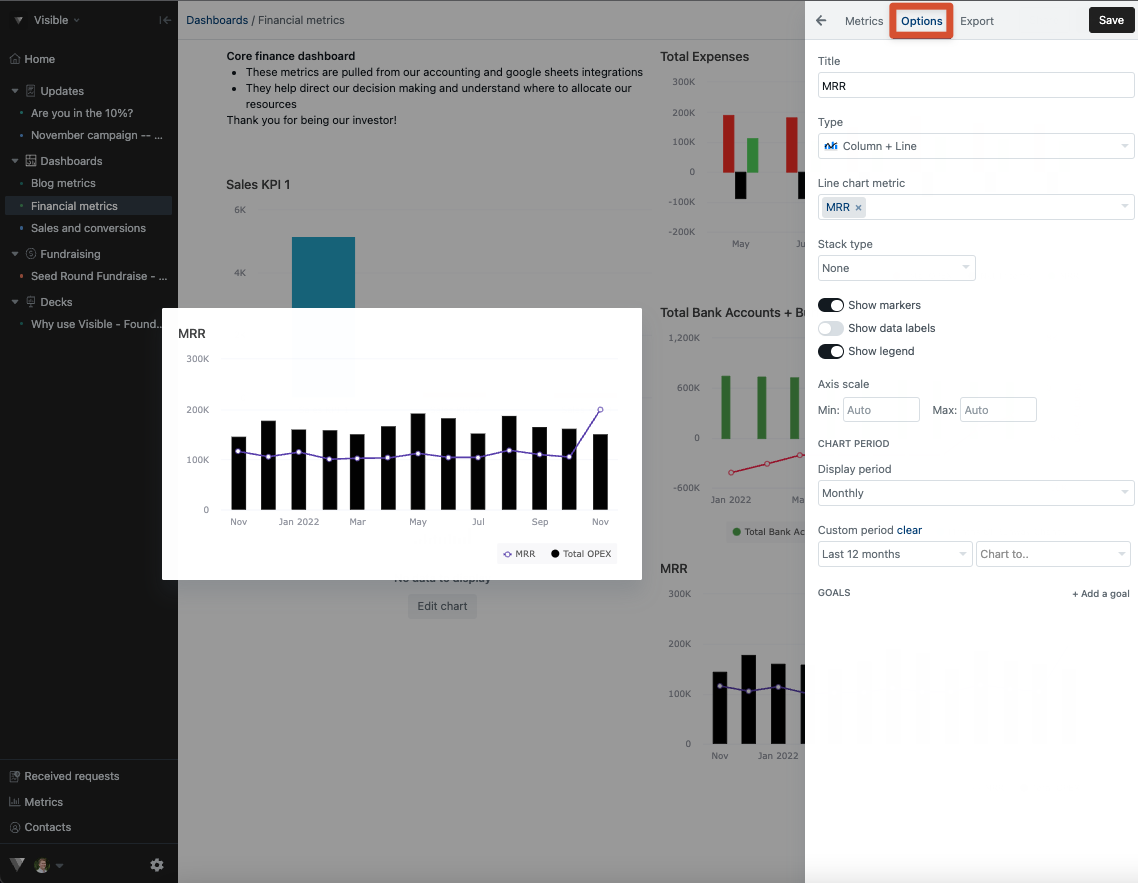
Click Options along the top of your chart editor
Input a Min and Max to set a custom y-axis scale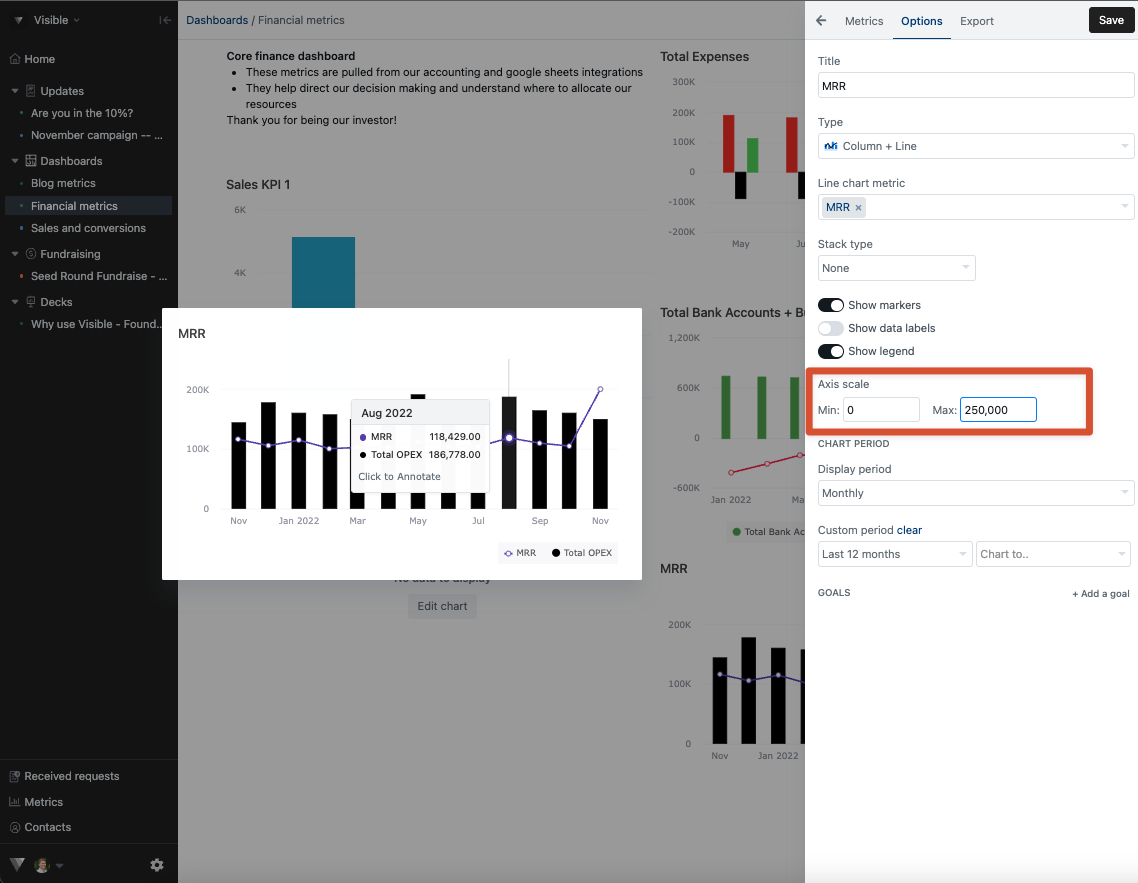
Click Save in the top right corner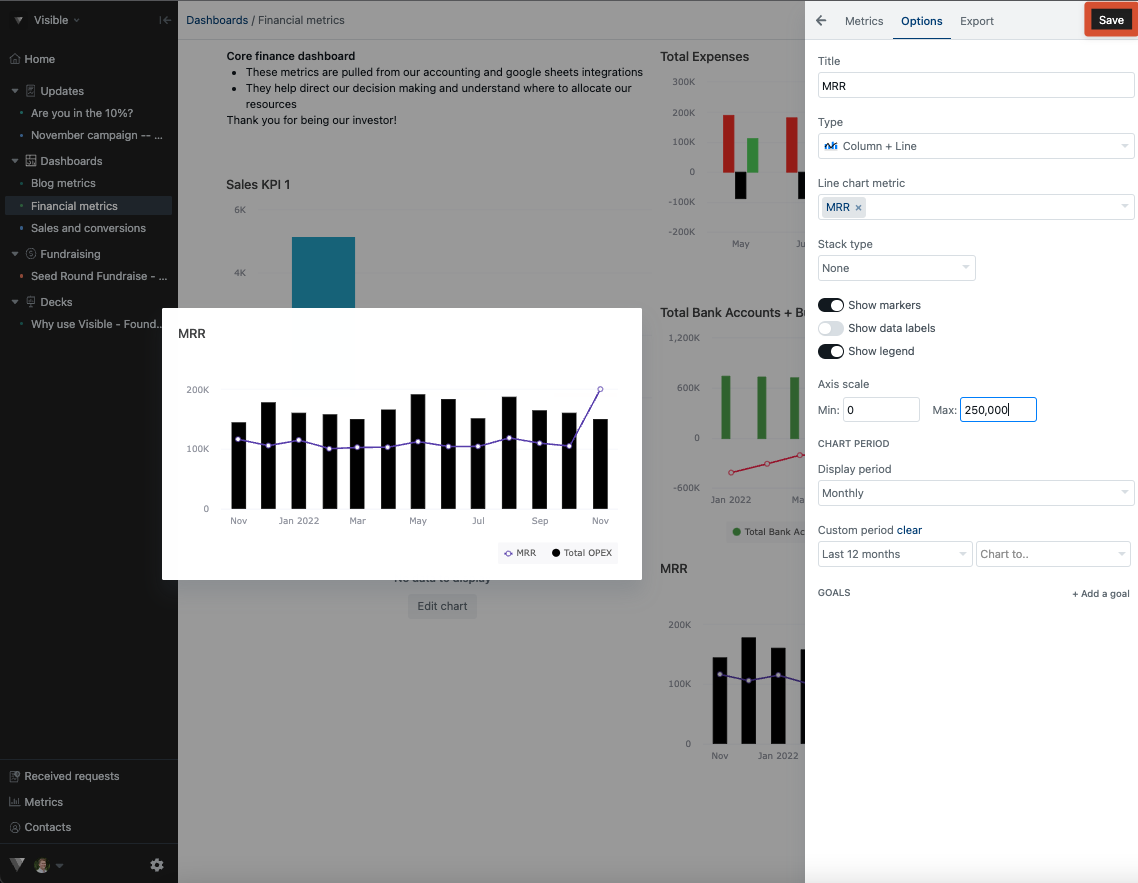
Please let us know if you have any questions!