
This article should help with how to create a pie chart in Visible
To create a pie chart, you will want to open Visible and open the dashboard where you would like your pie chart to exist. Click + New in the top right of your dashboard and choose Chart or if you wish to turn an existing chart into a pie chart click the three dots on the top right of your chart and click Edit. Add metrics you would like to be displayed in your chart. Then, click Options along the top of your chart builder. Where it says Chart type, you will want to select Pie. Your chart will now display as a pie chart.
See screenshots of the process below.
Open Visible
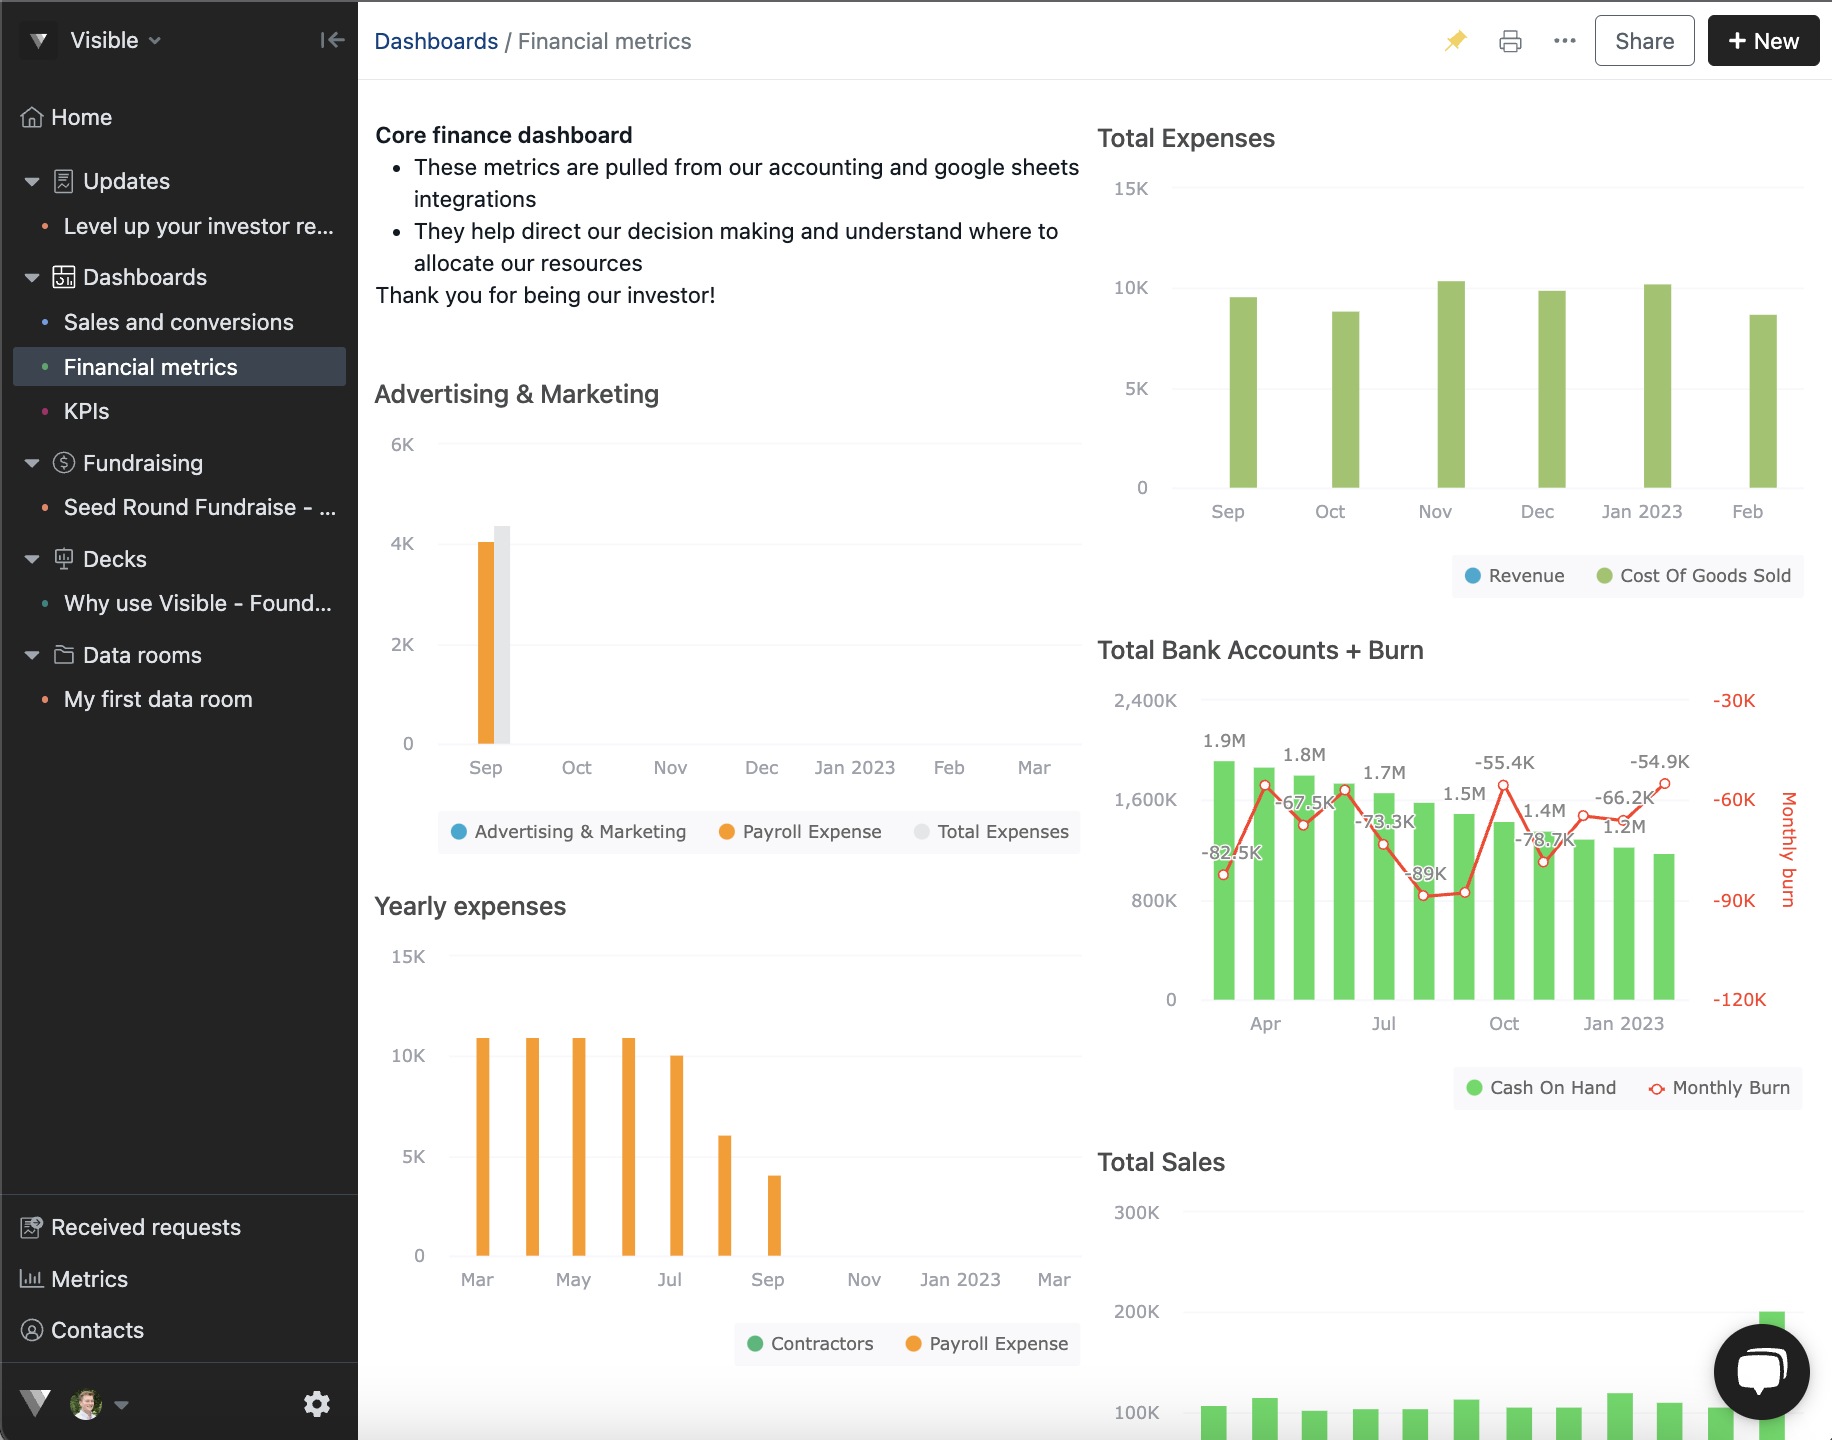
Open the dashboard where you'd like your Pie chart to exist
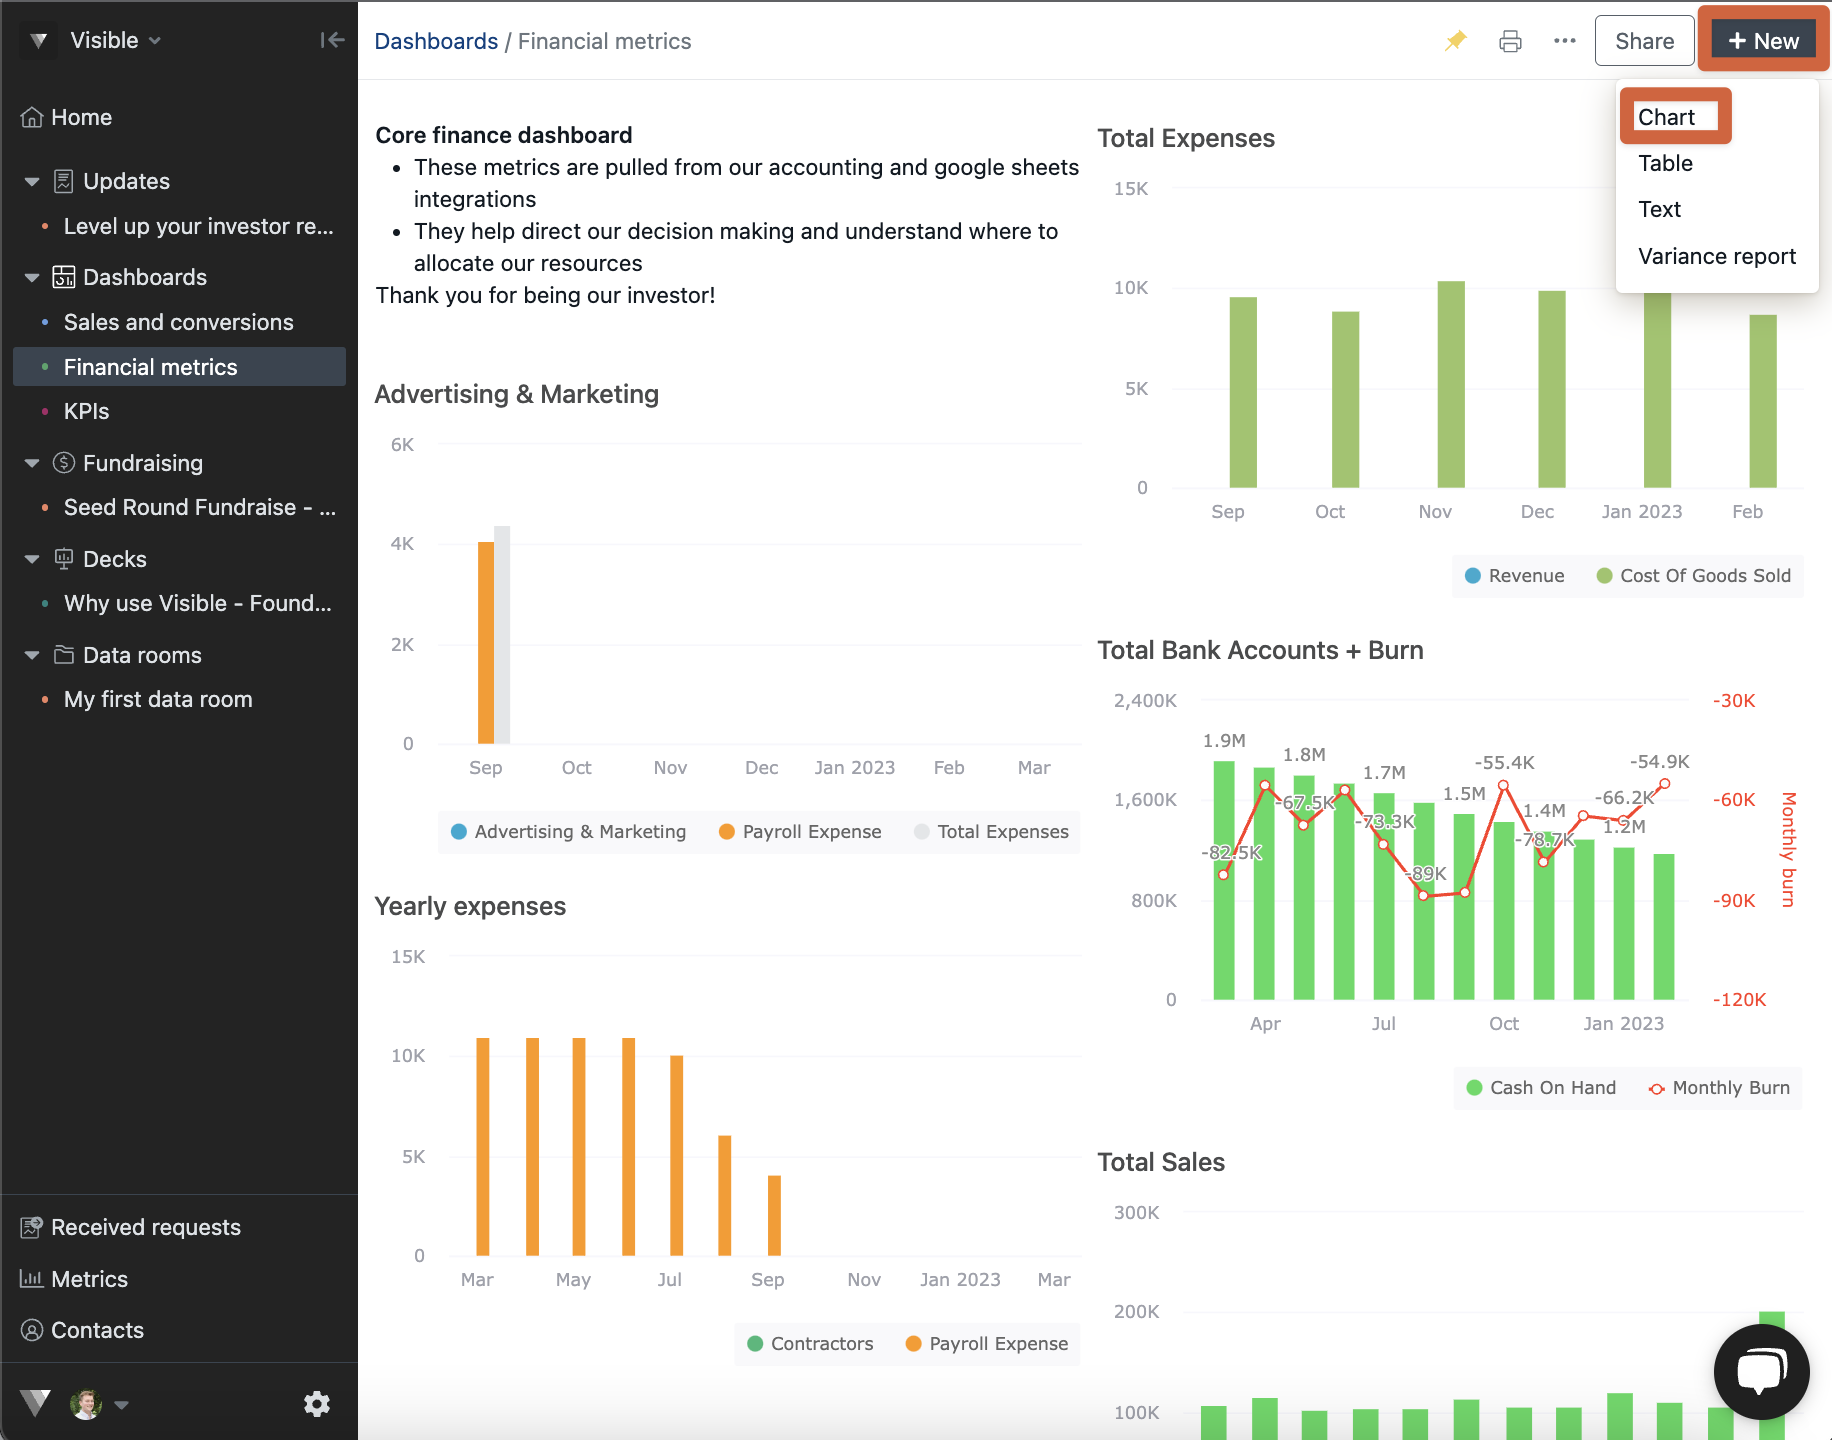
Click + New in the top right and then Chart
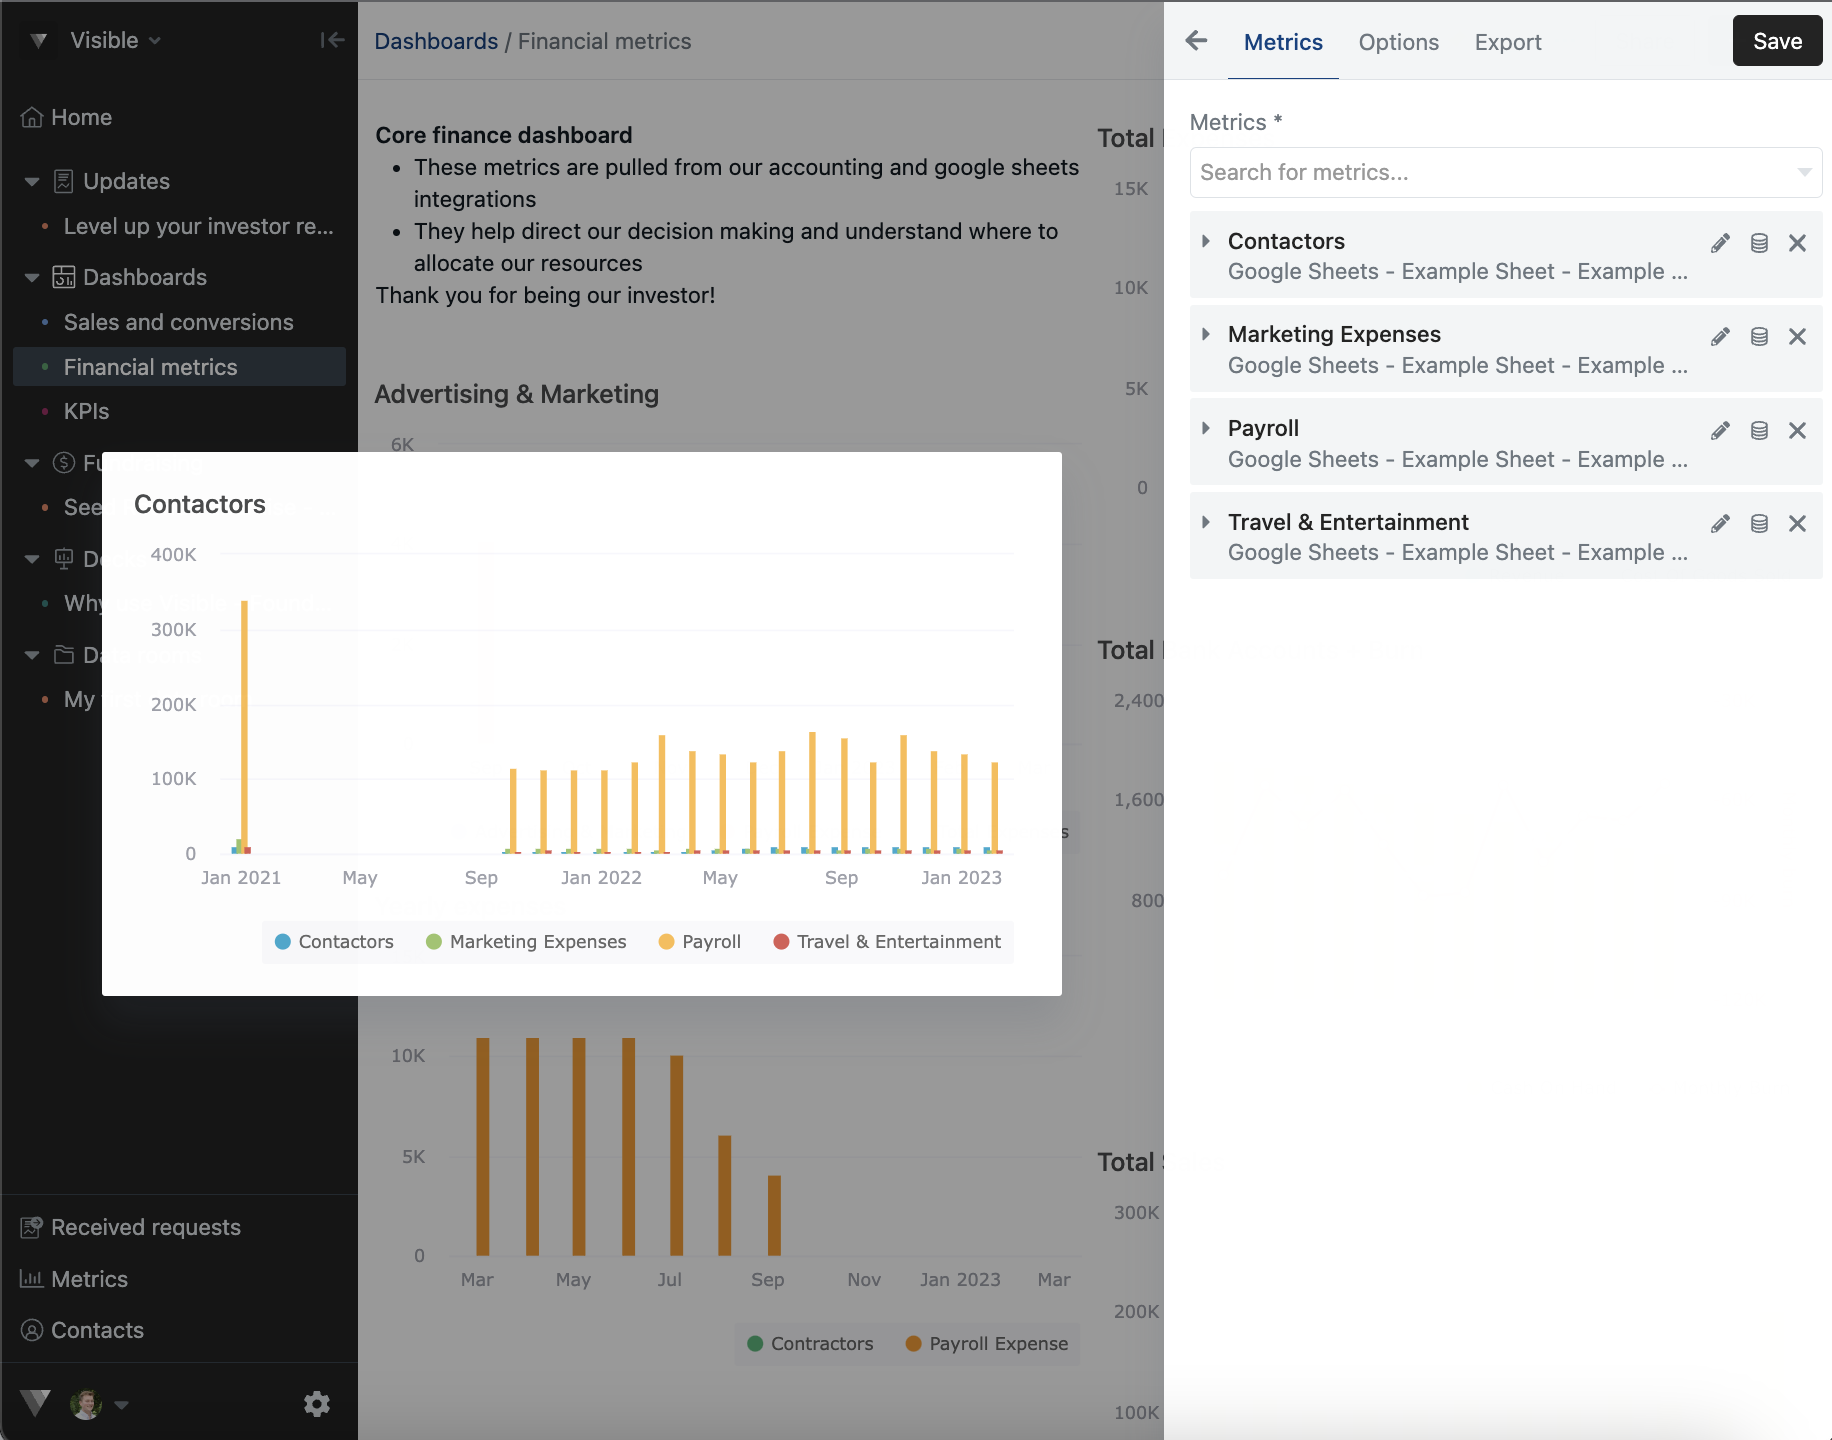
Add the metrics you wish to be displayed in your pie chart
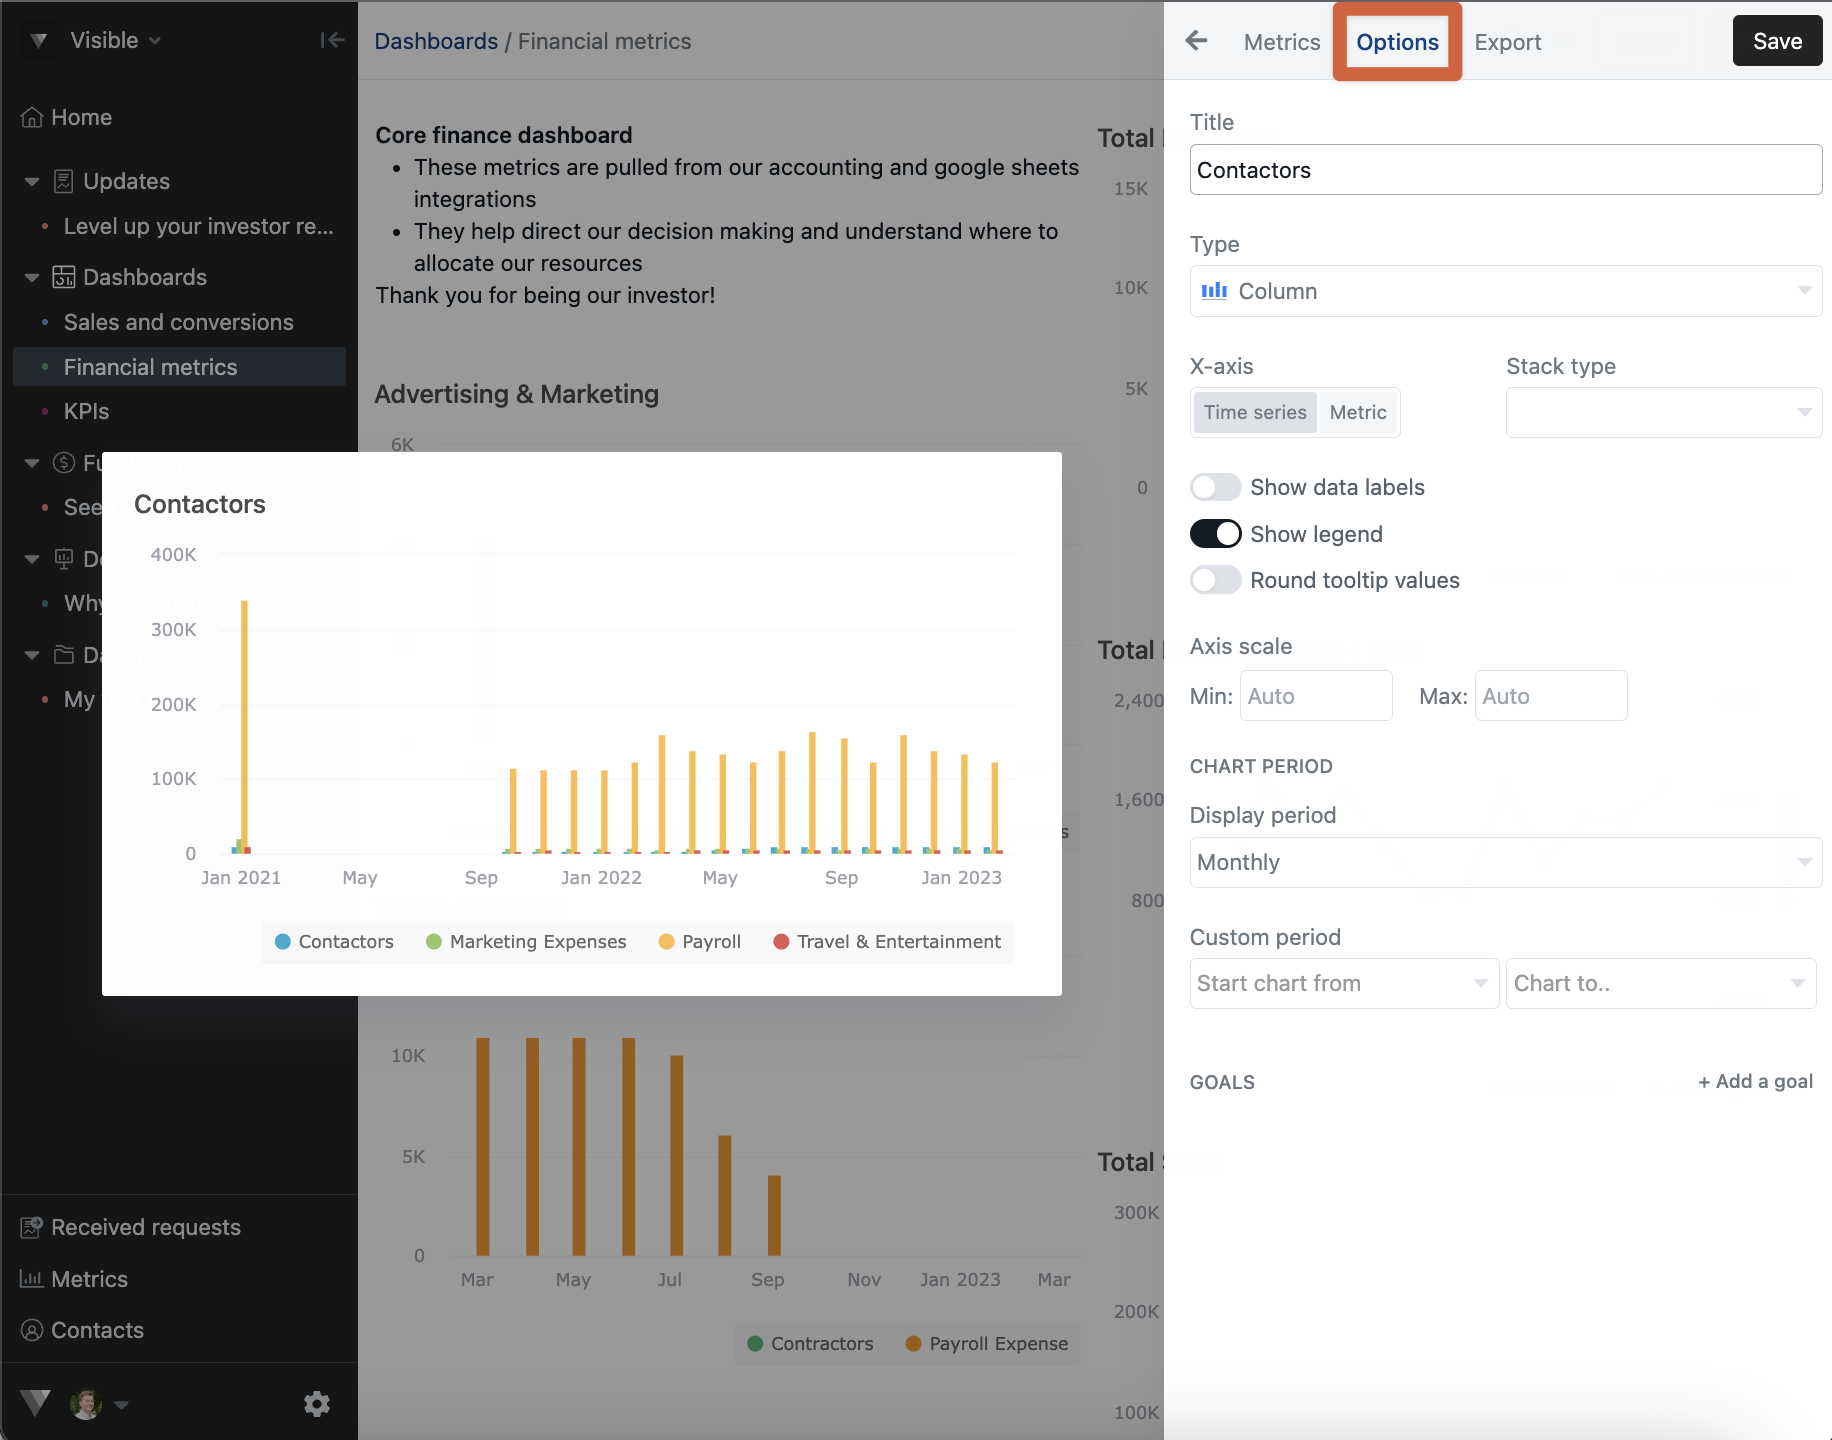
Click Options along the top of your chart builder
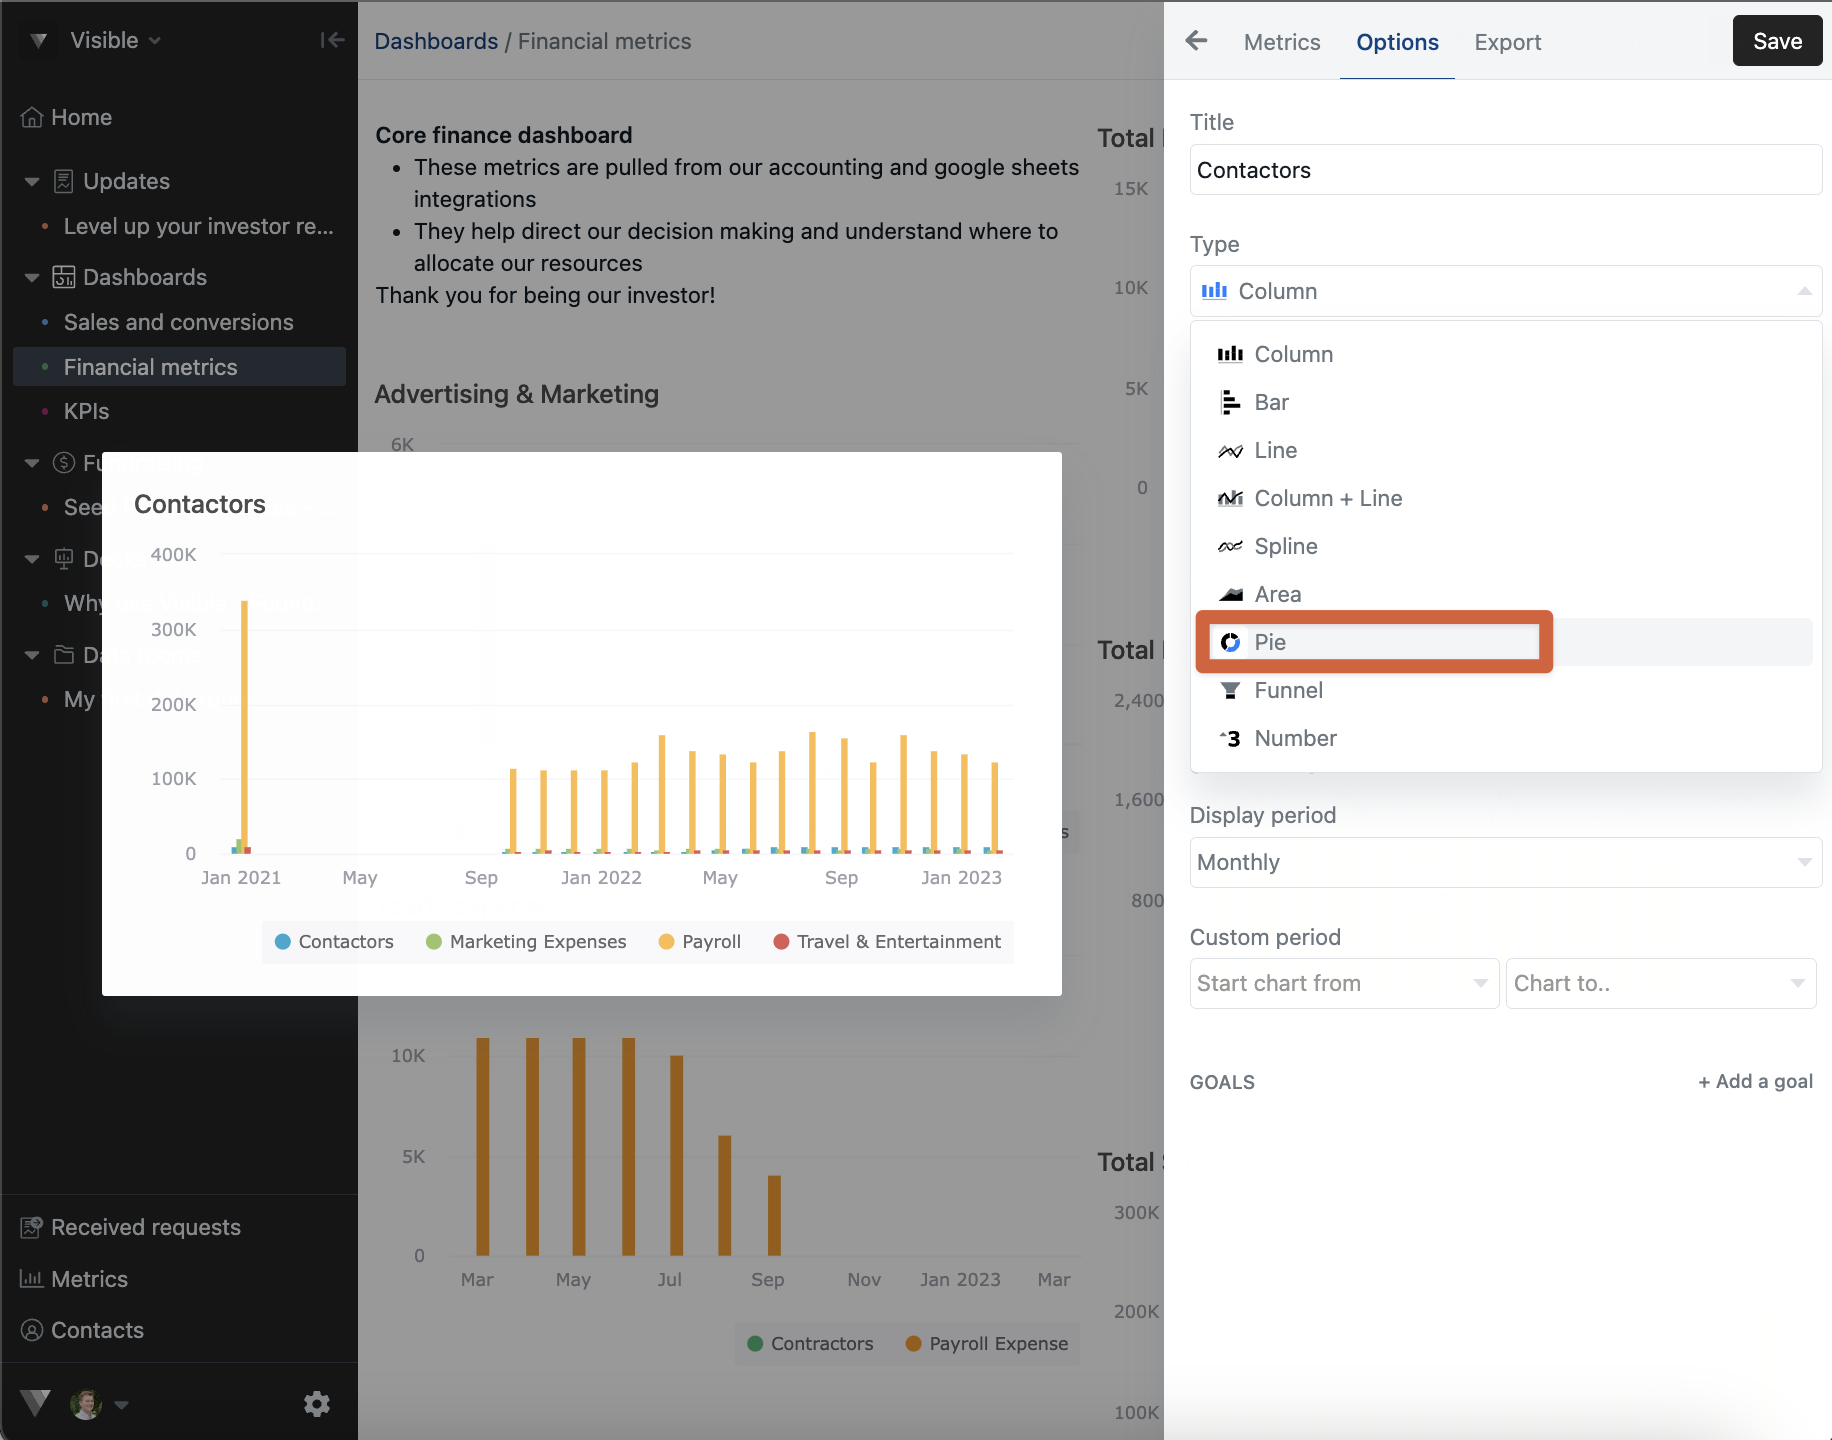
Choose Pie as the chart type
Click Save in the top right of your chart.
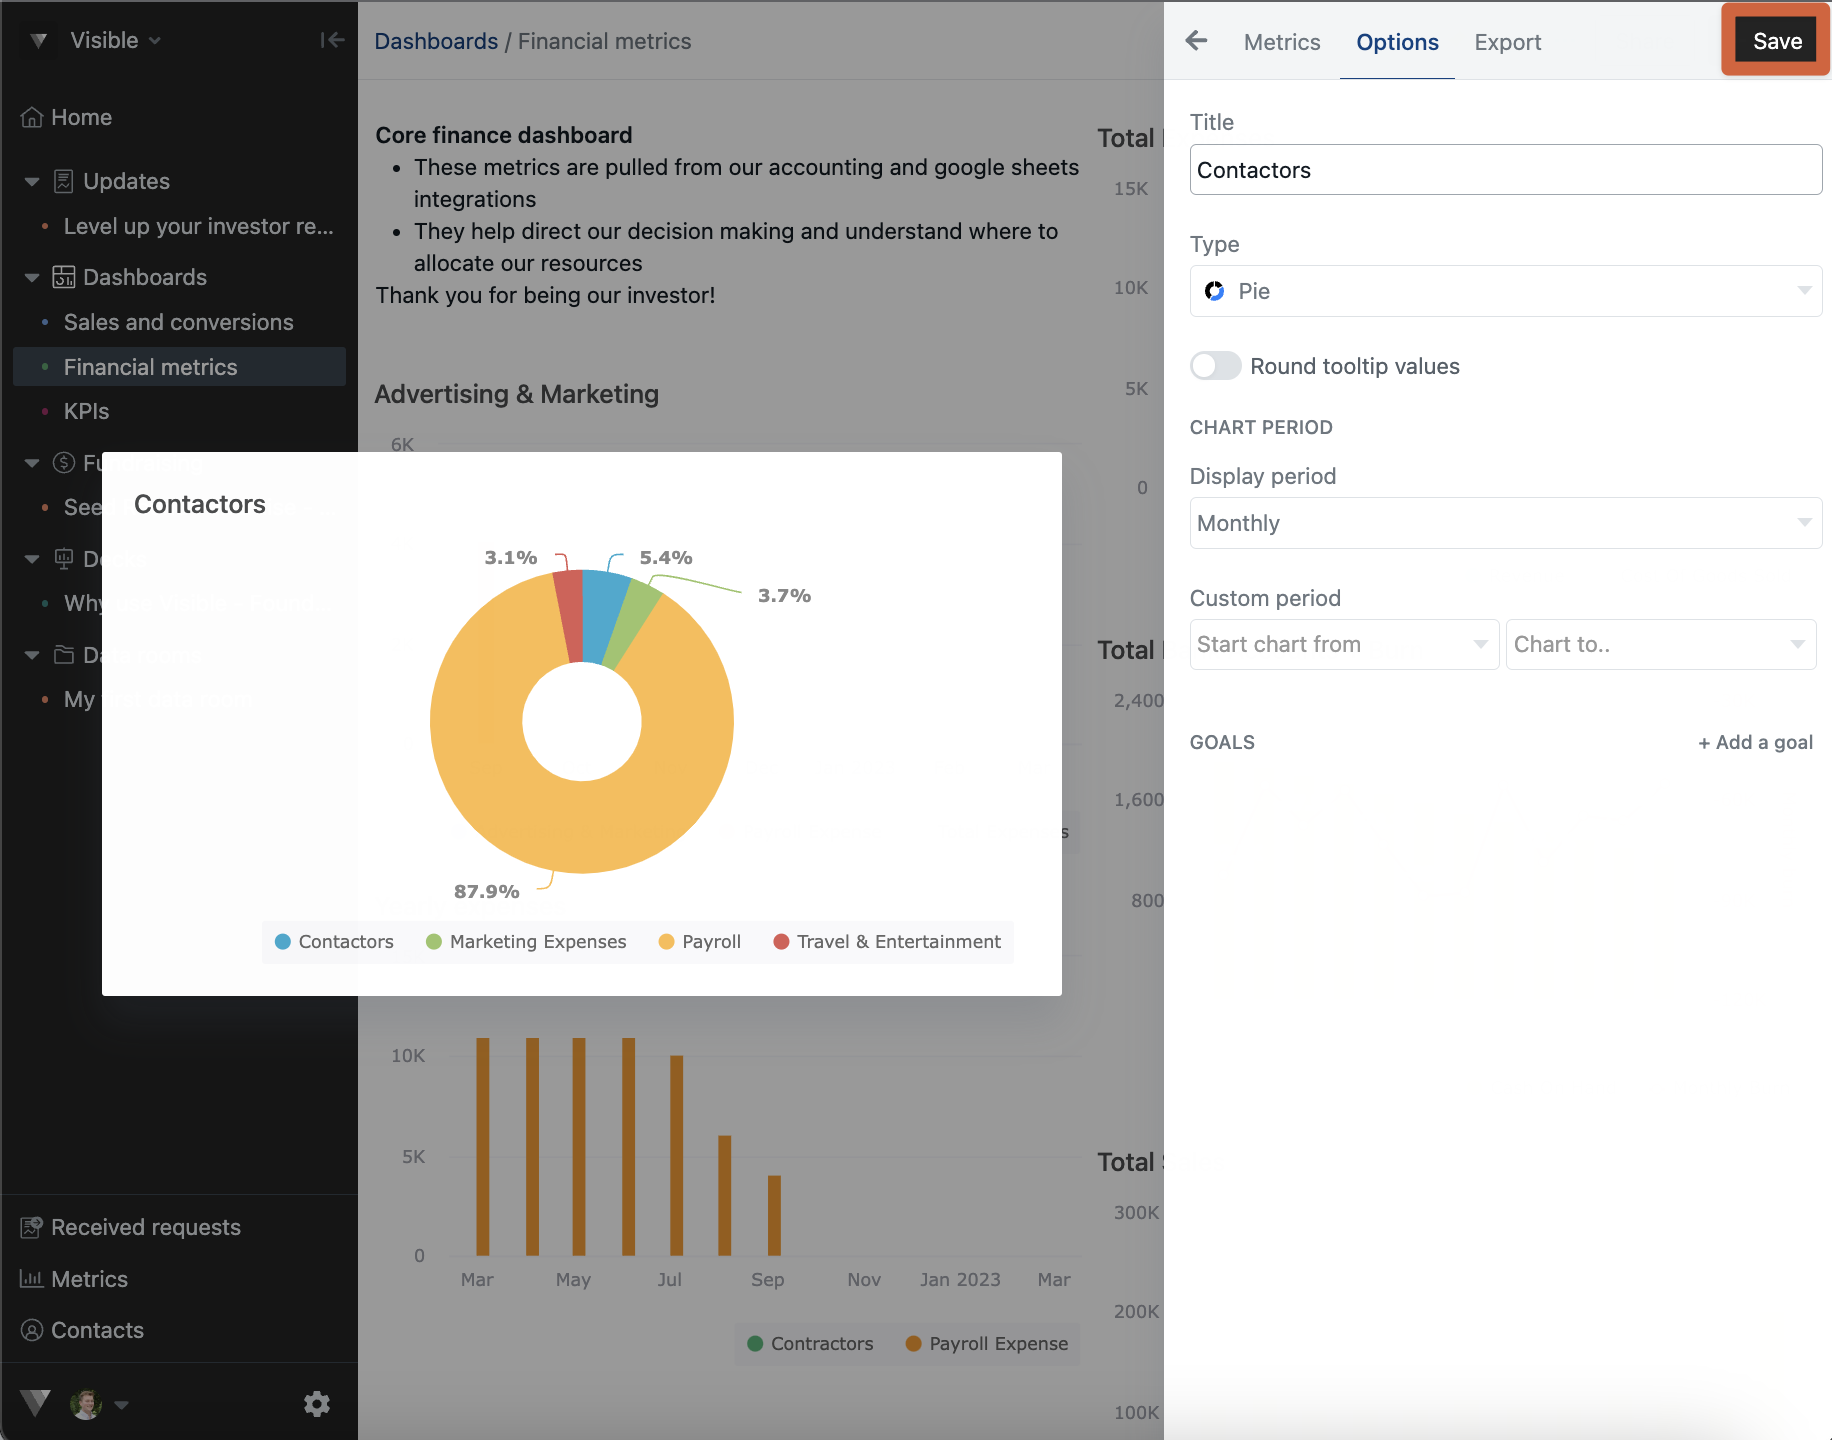
Now your Pie chart will be saved on your dashboard and refresh along with your data source. Please let us know if your have any questions.