
How to create a variance report Tips, best practices and an overview of our variance report functionality.
Variance reporting is great way to calculate how your actual performance compares to a budget or forecast. To get started head to your dashboard + New -> Variance report

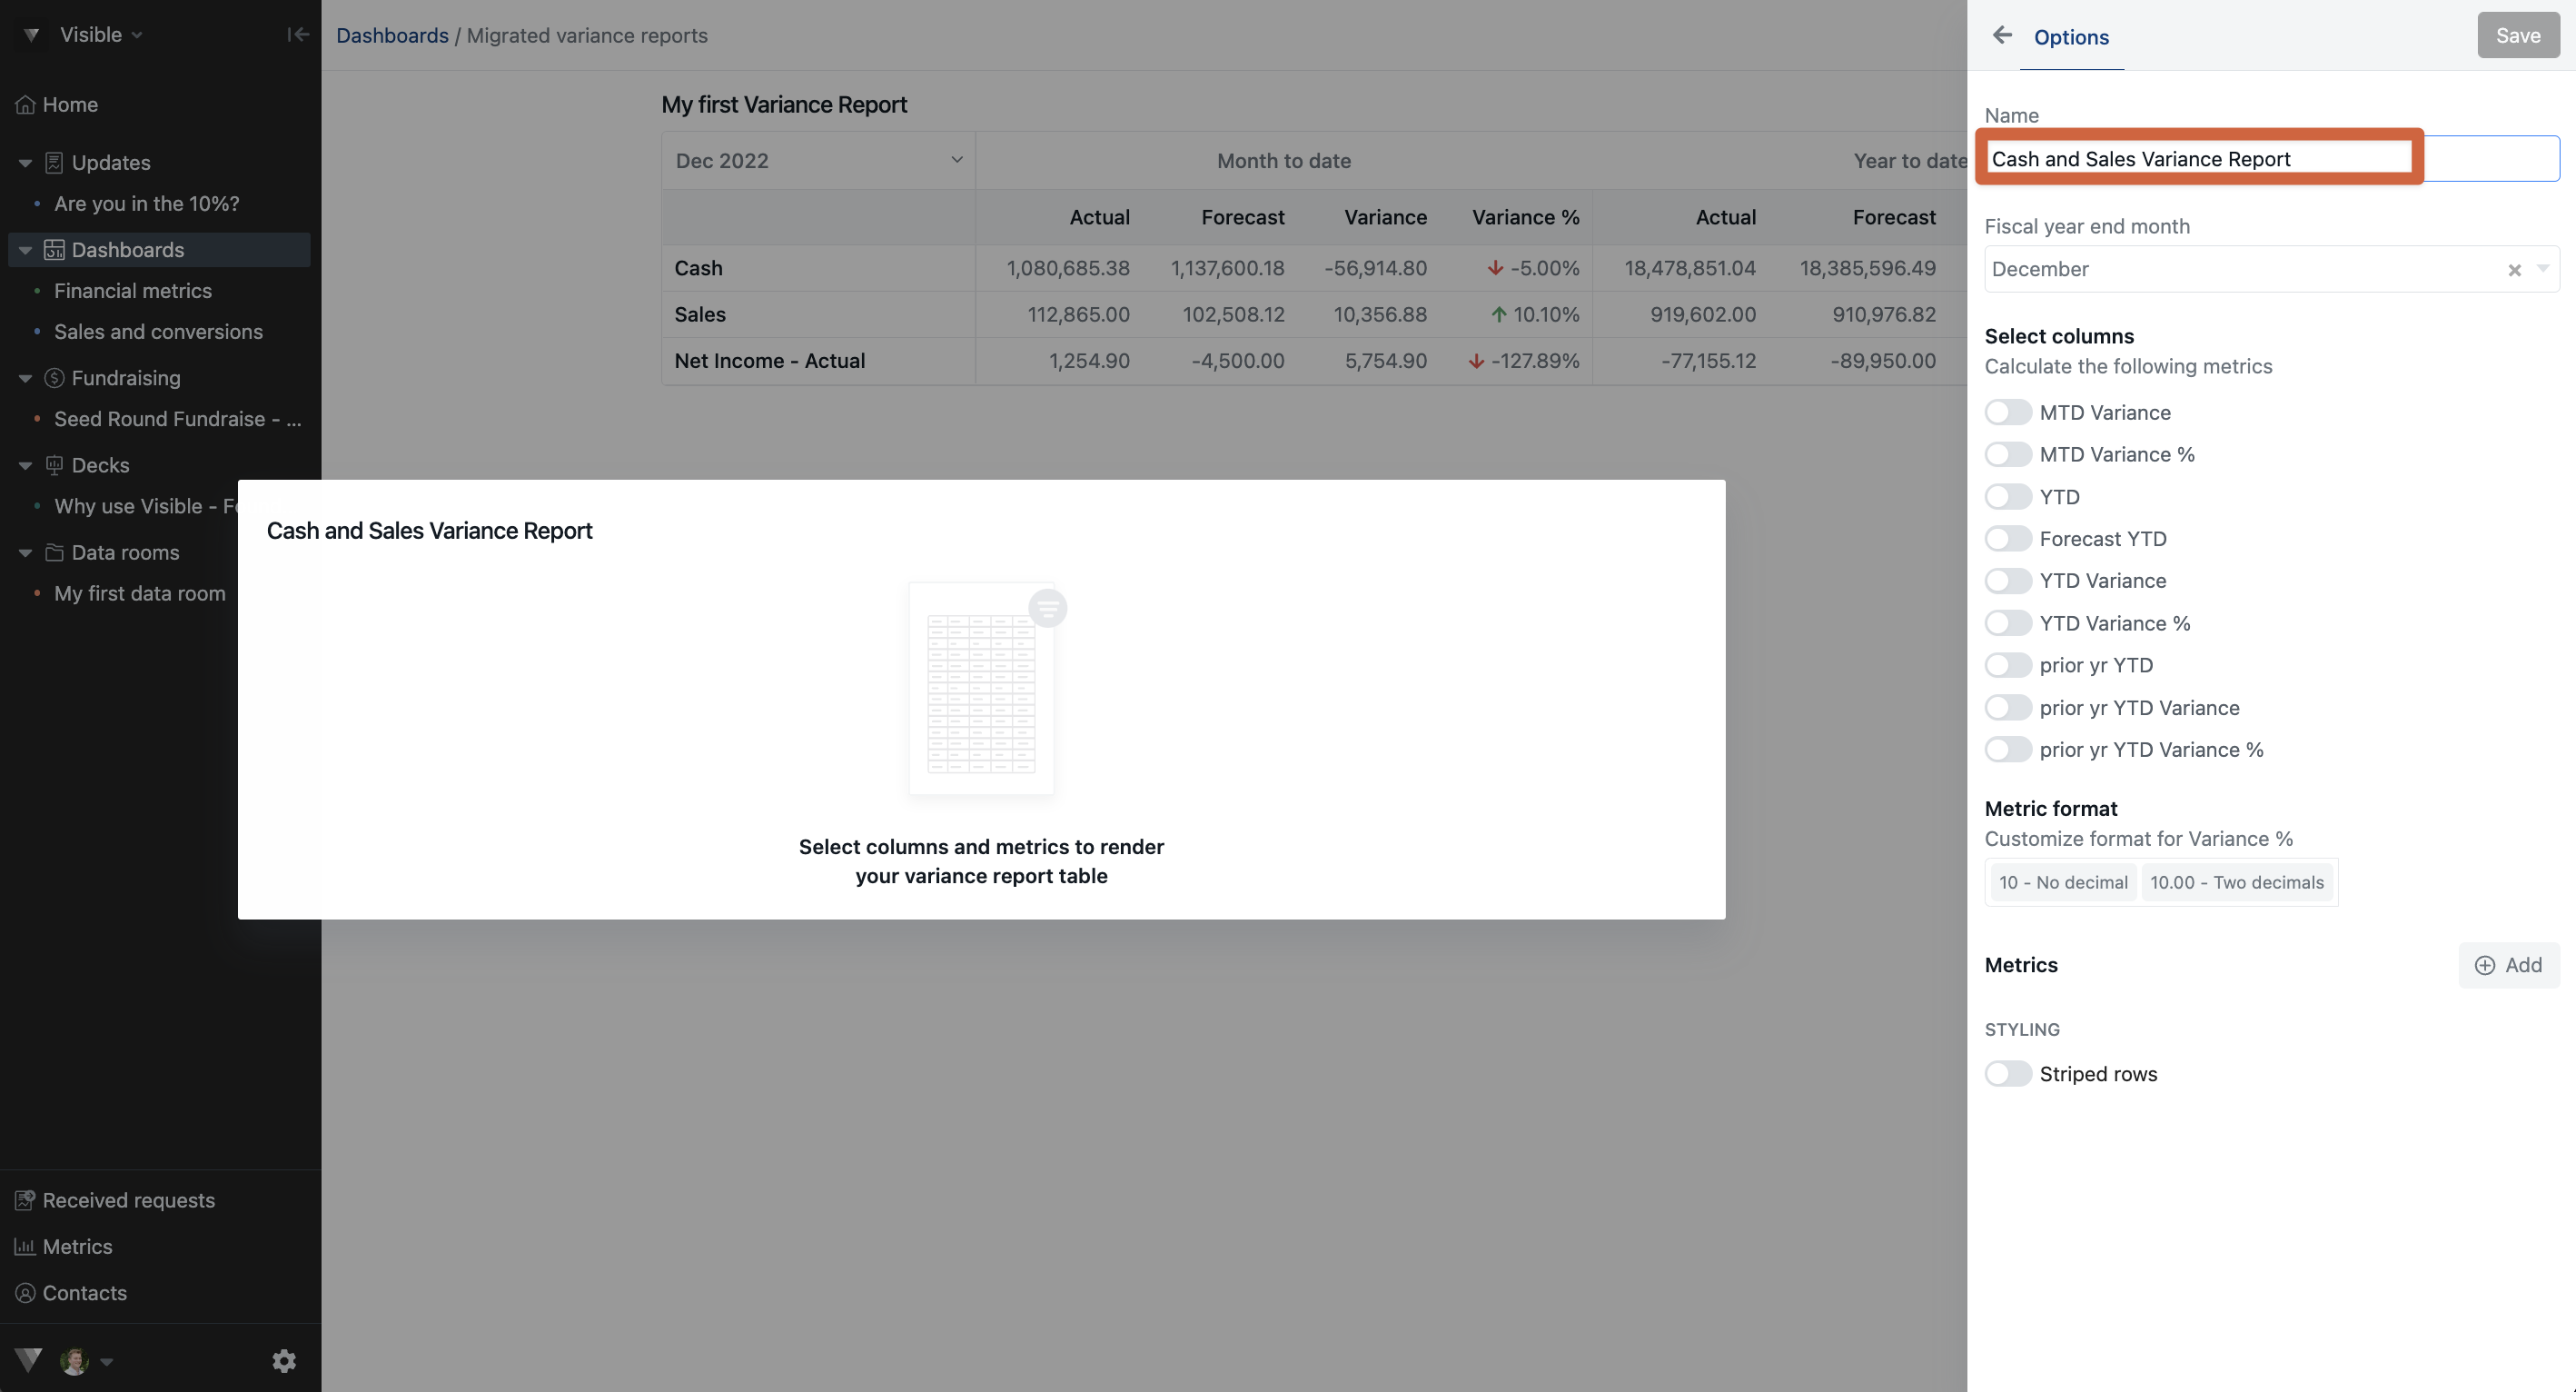
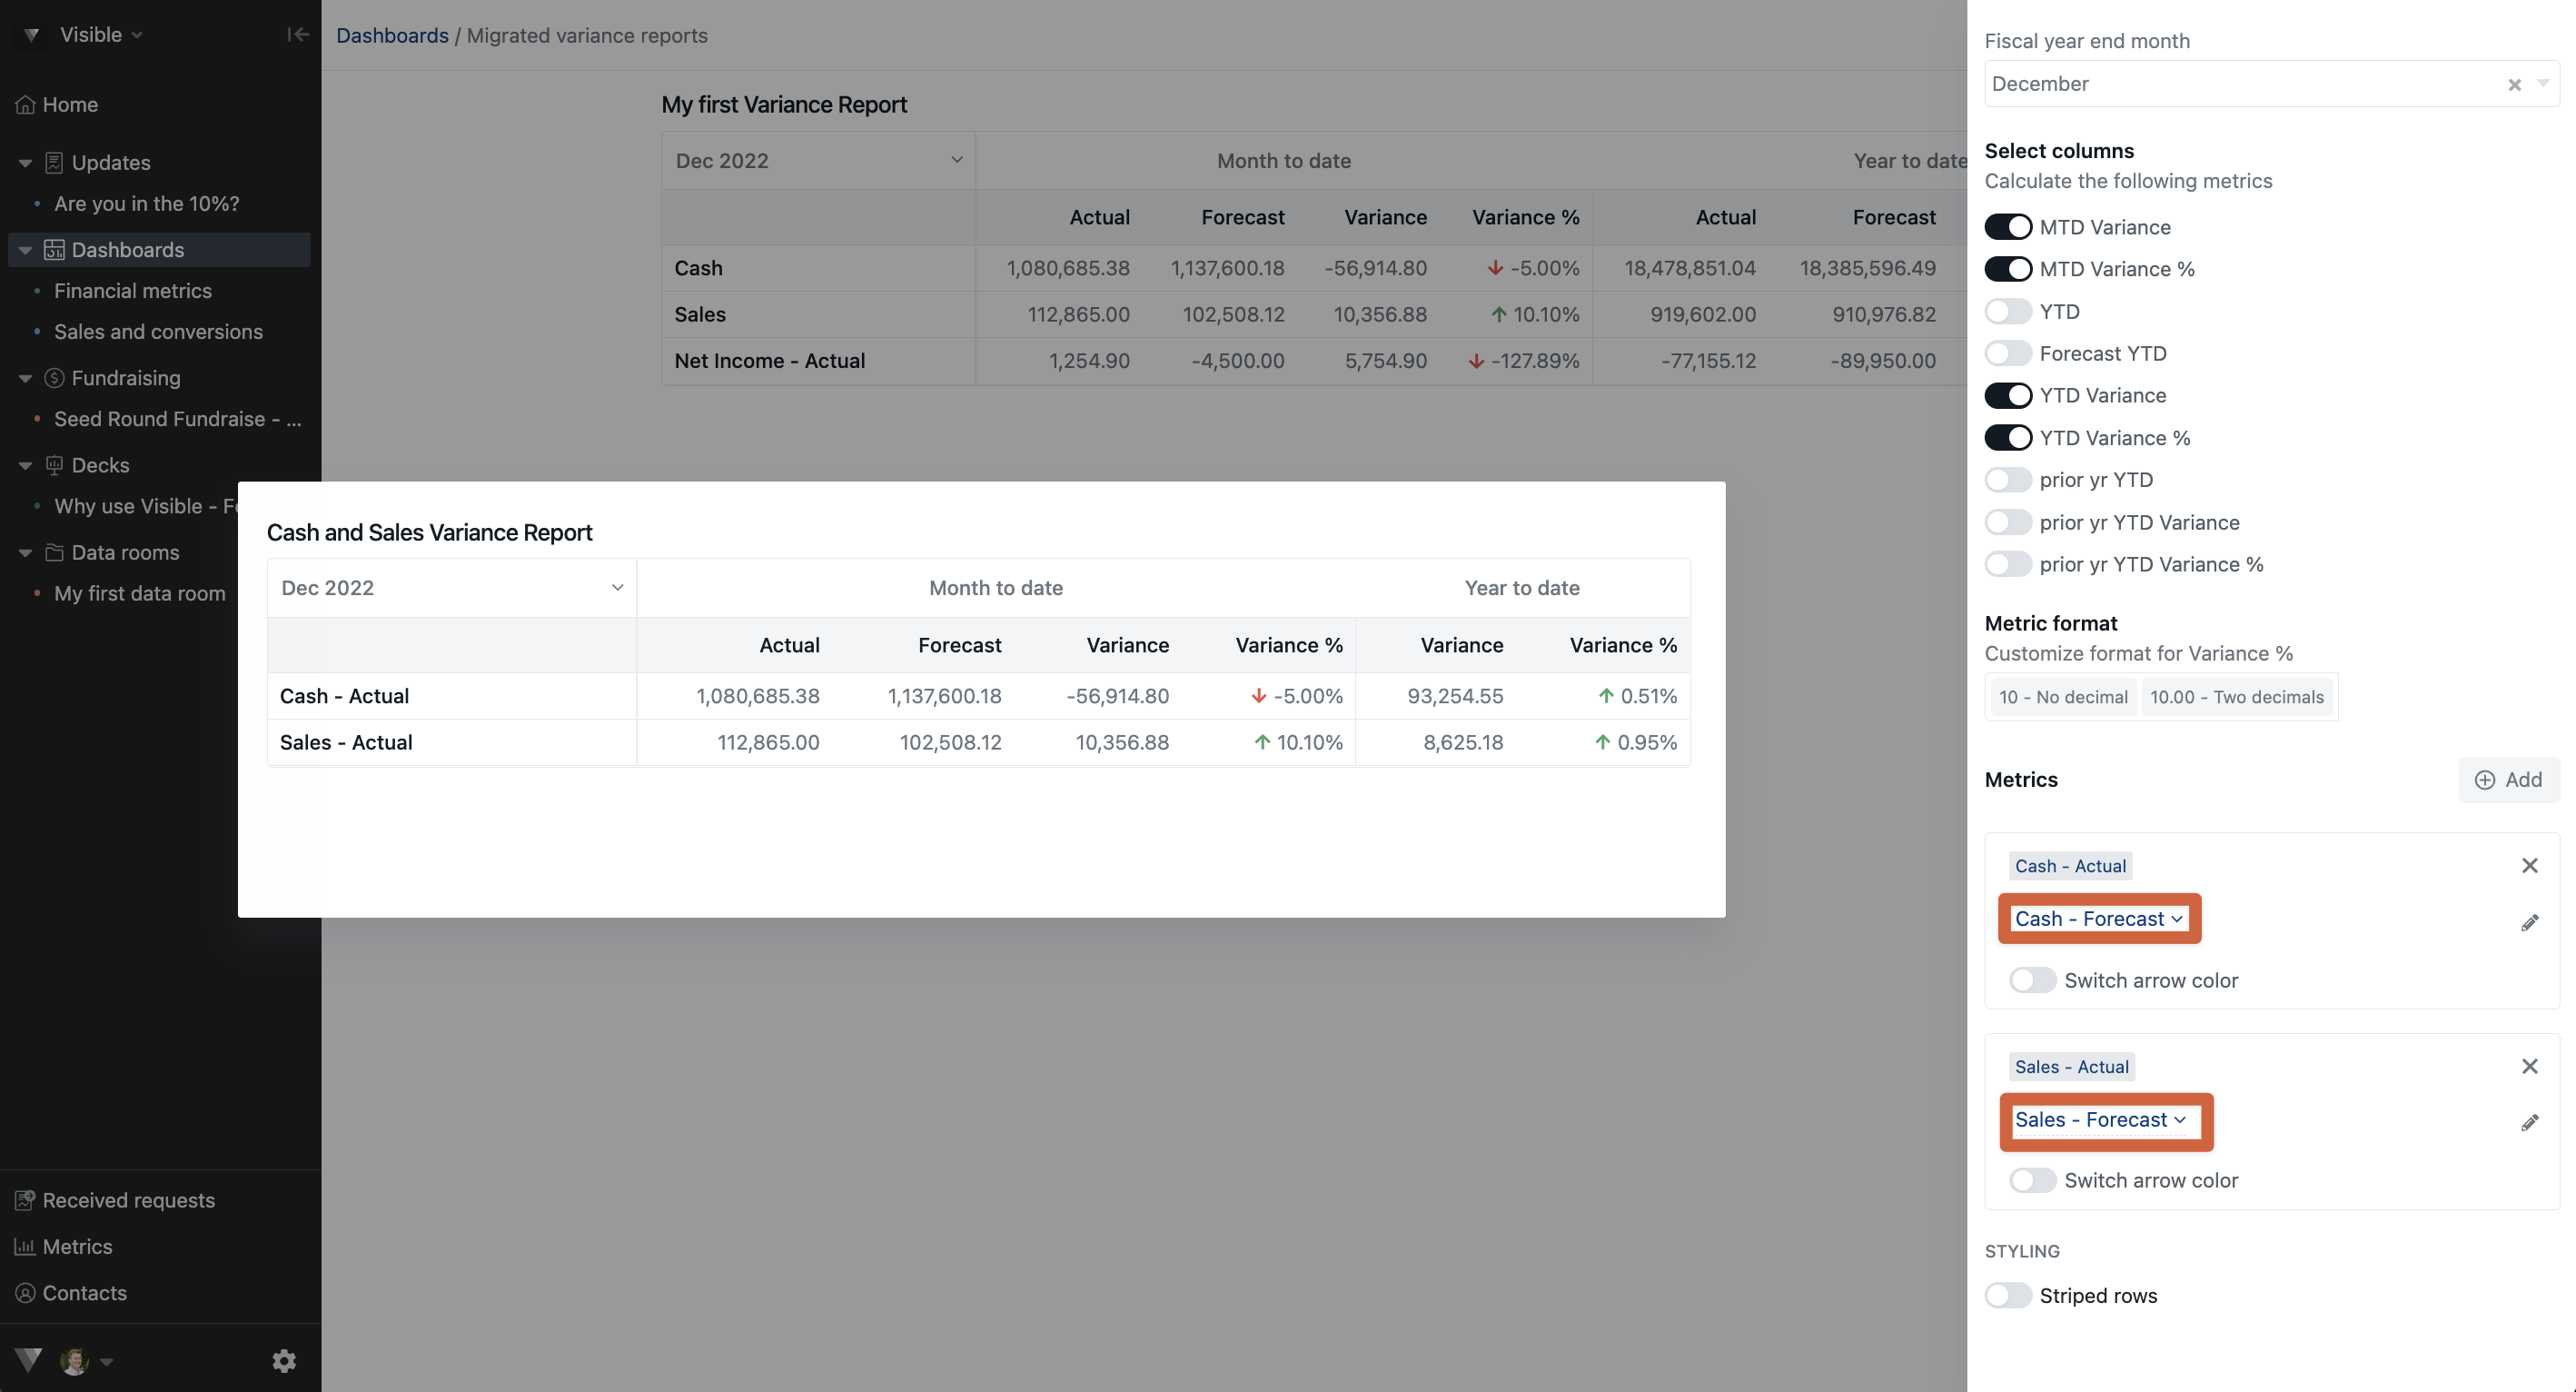
This will allow you to build a Variance Report from your metrics directly onto your dashboard. When in the Variance report builder, you'll be able to perform the following actions, as shown in the below screenshot:
-
Title your Variance report
-
Choosing an actual metric to contrast the forecast/budget metric. E.g. Revenue and Revenue - Forecast.
-
Drag & Drop the position of the metrics
-
-
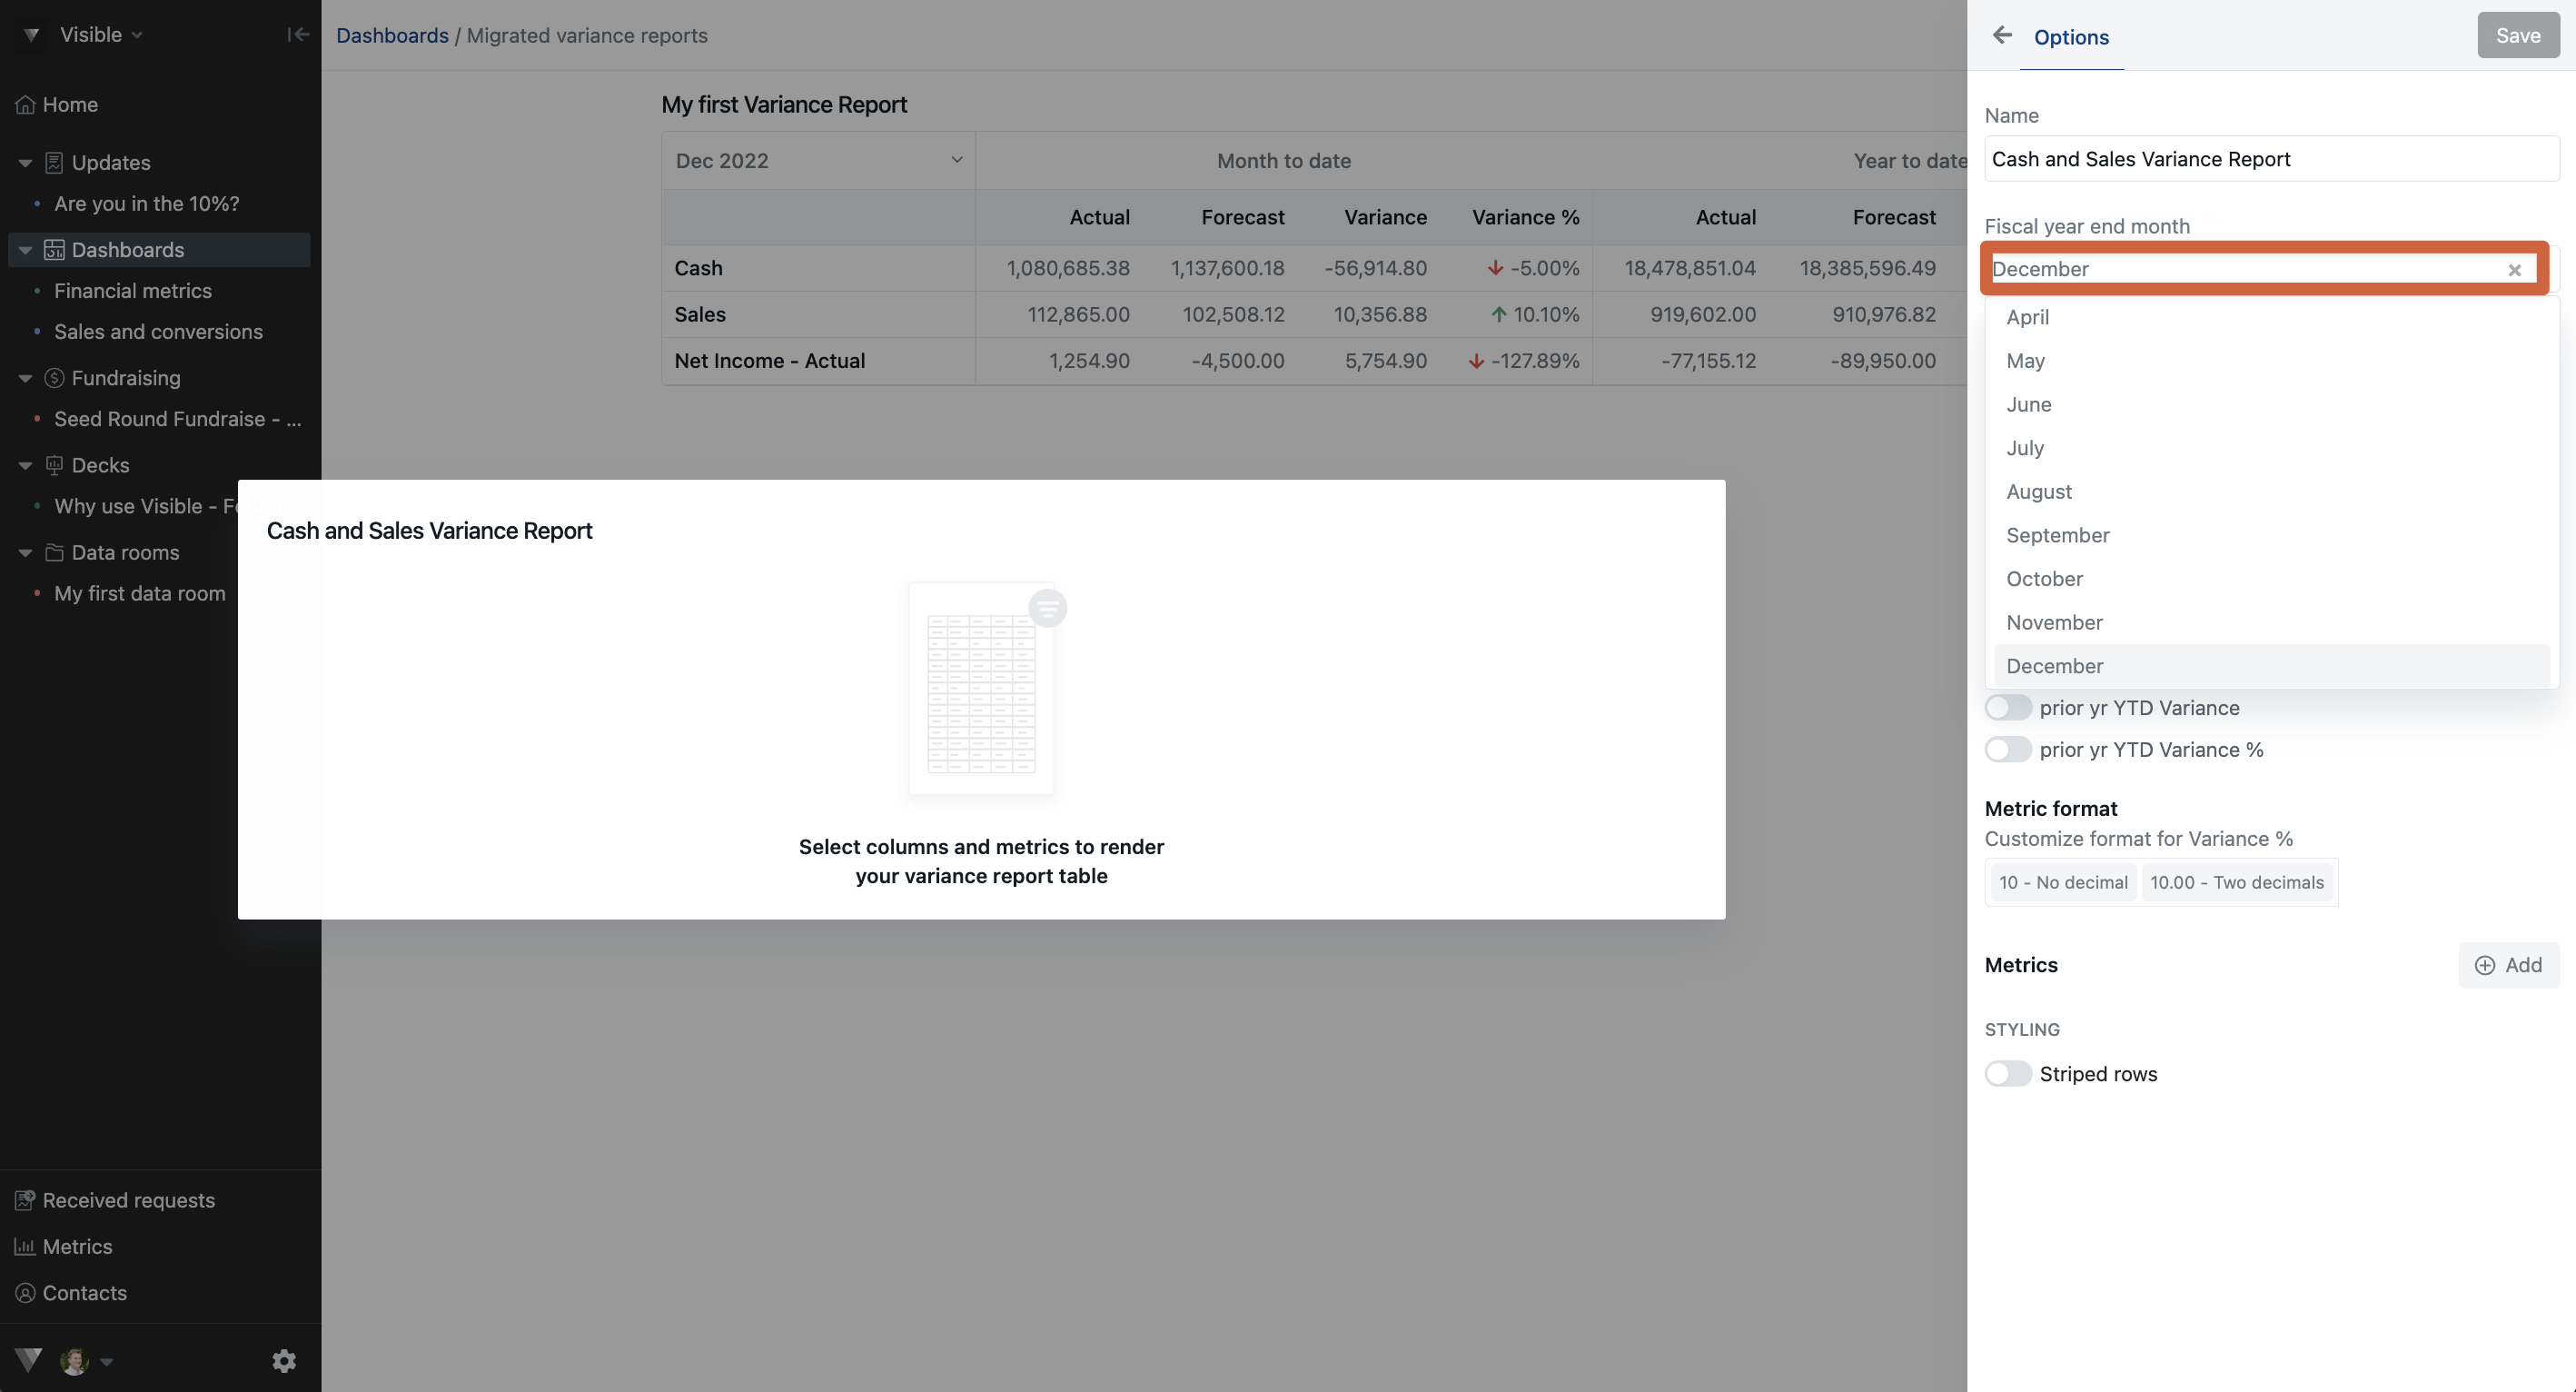
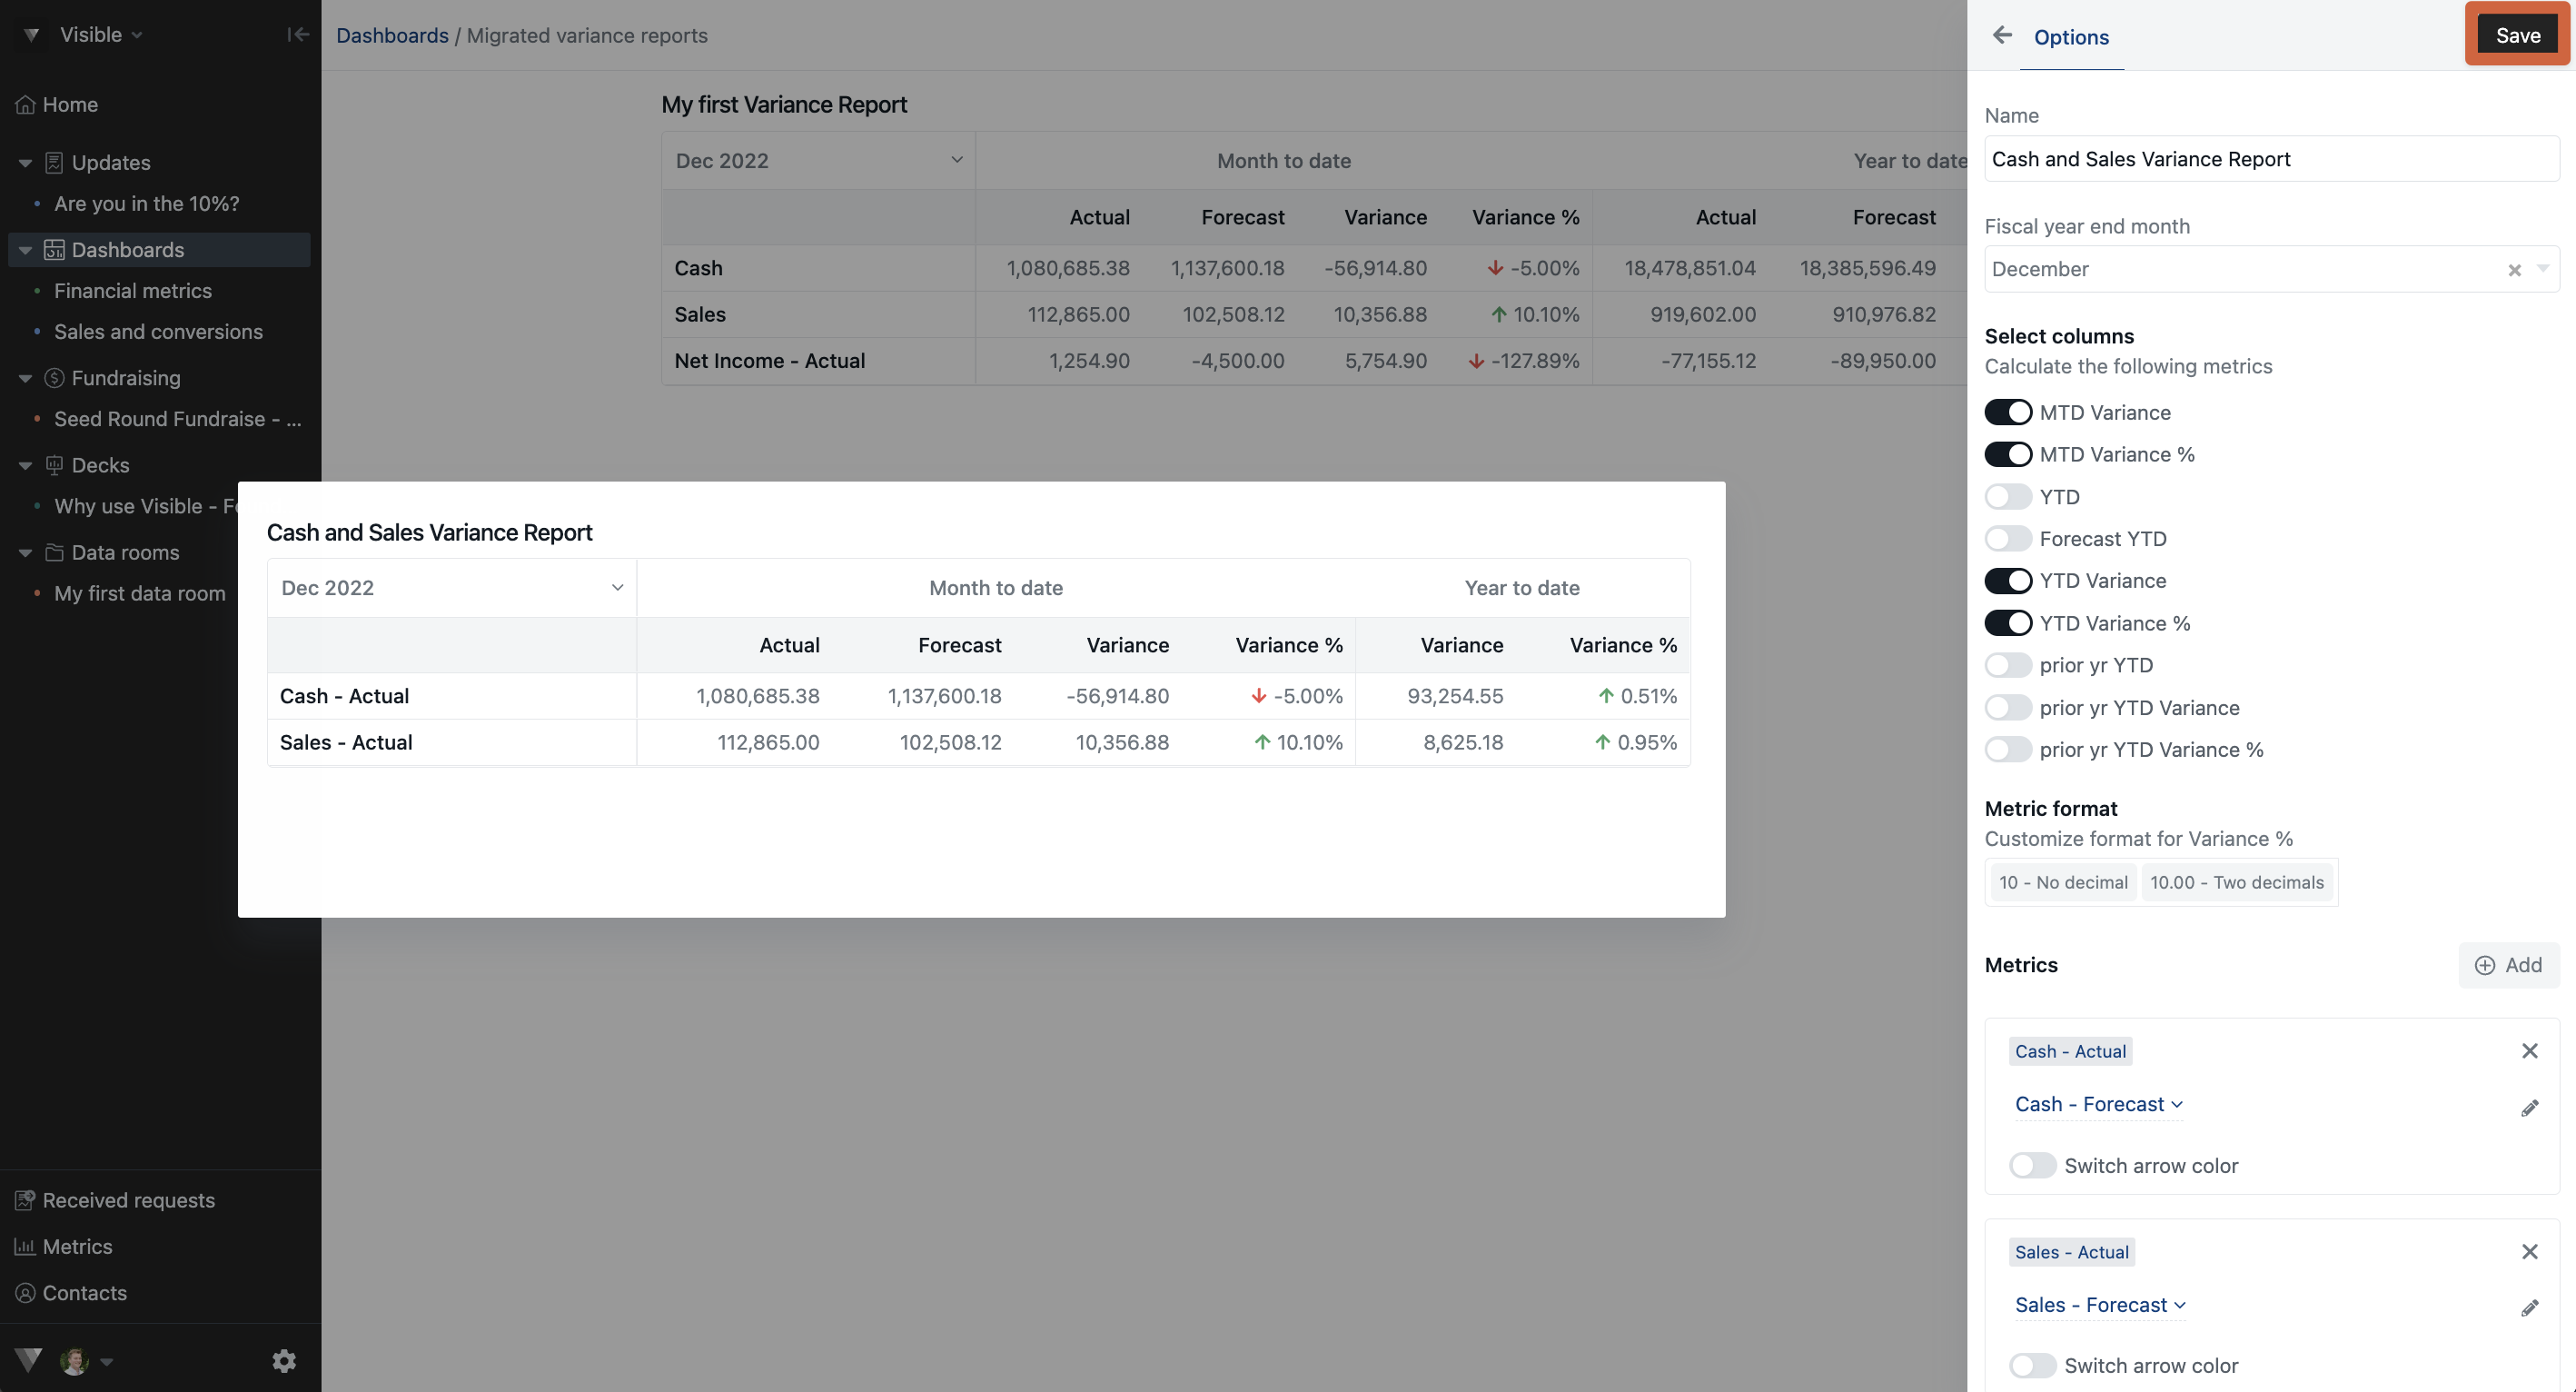
Select your fiscal year-end
-
This is helpful for non-calendar years when calculating YTD variance report metrics
-
-
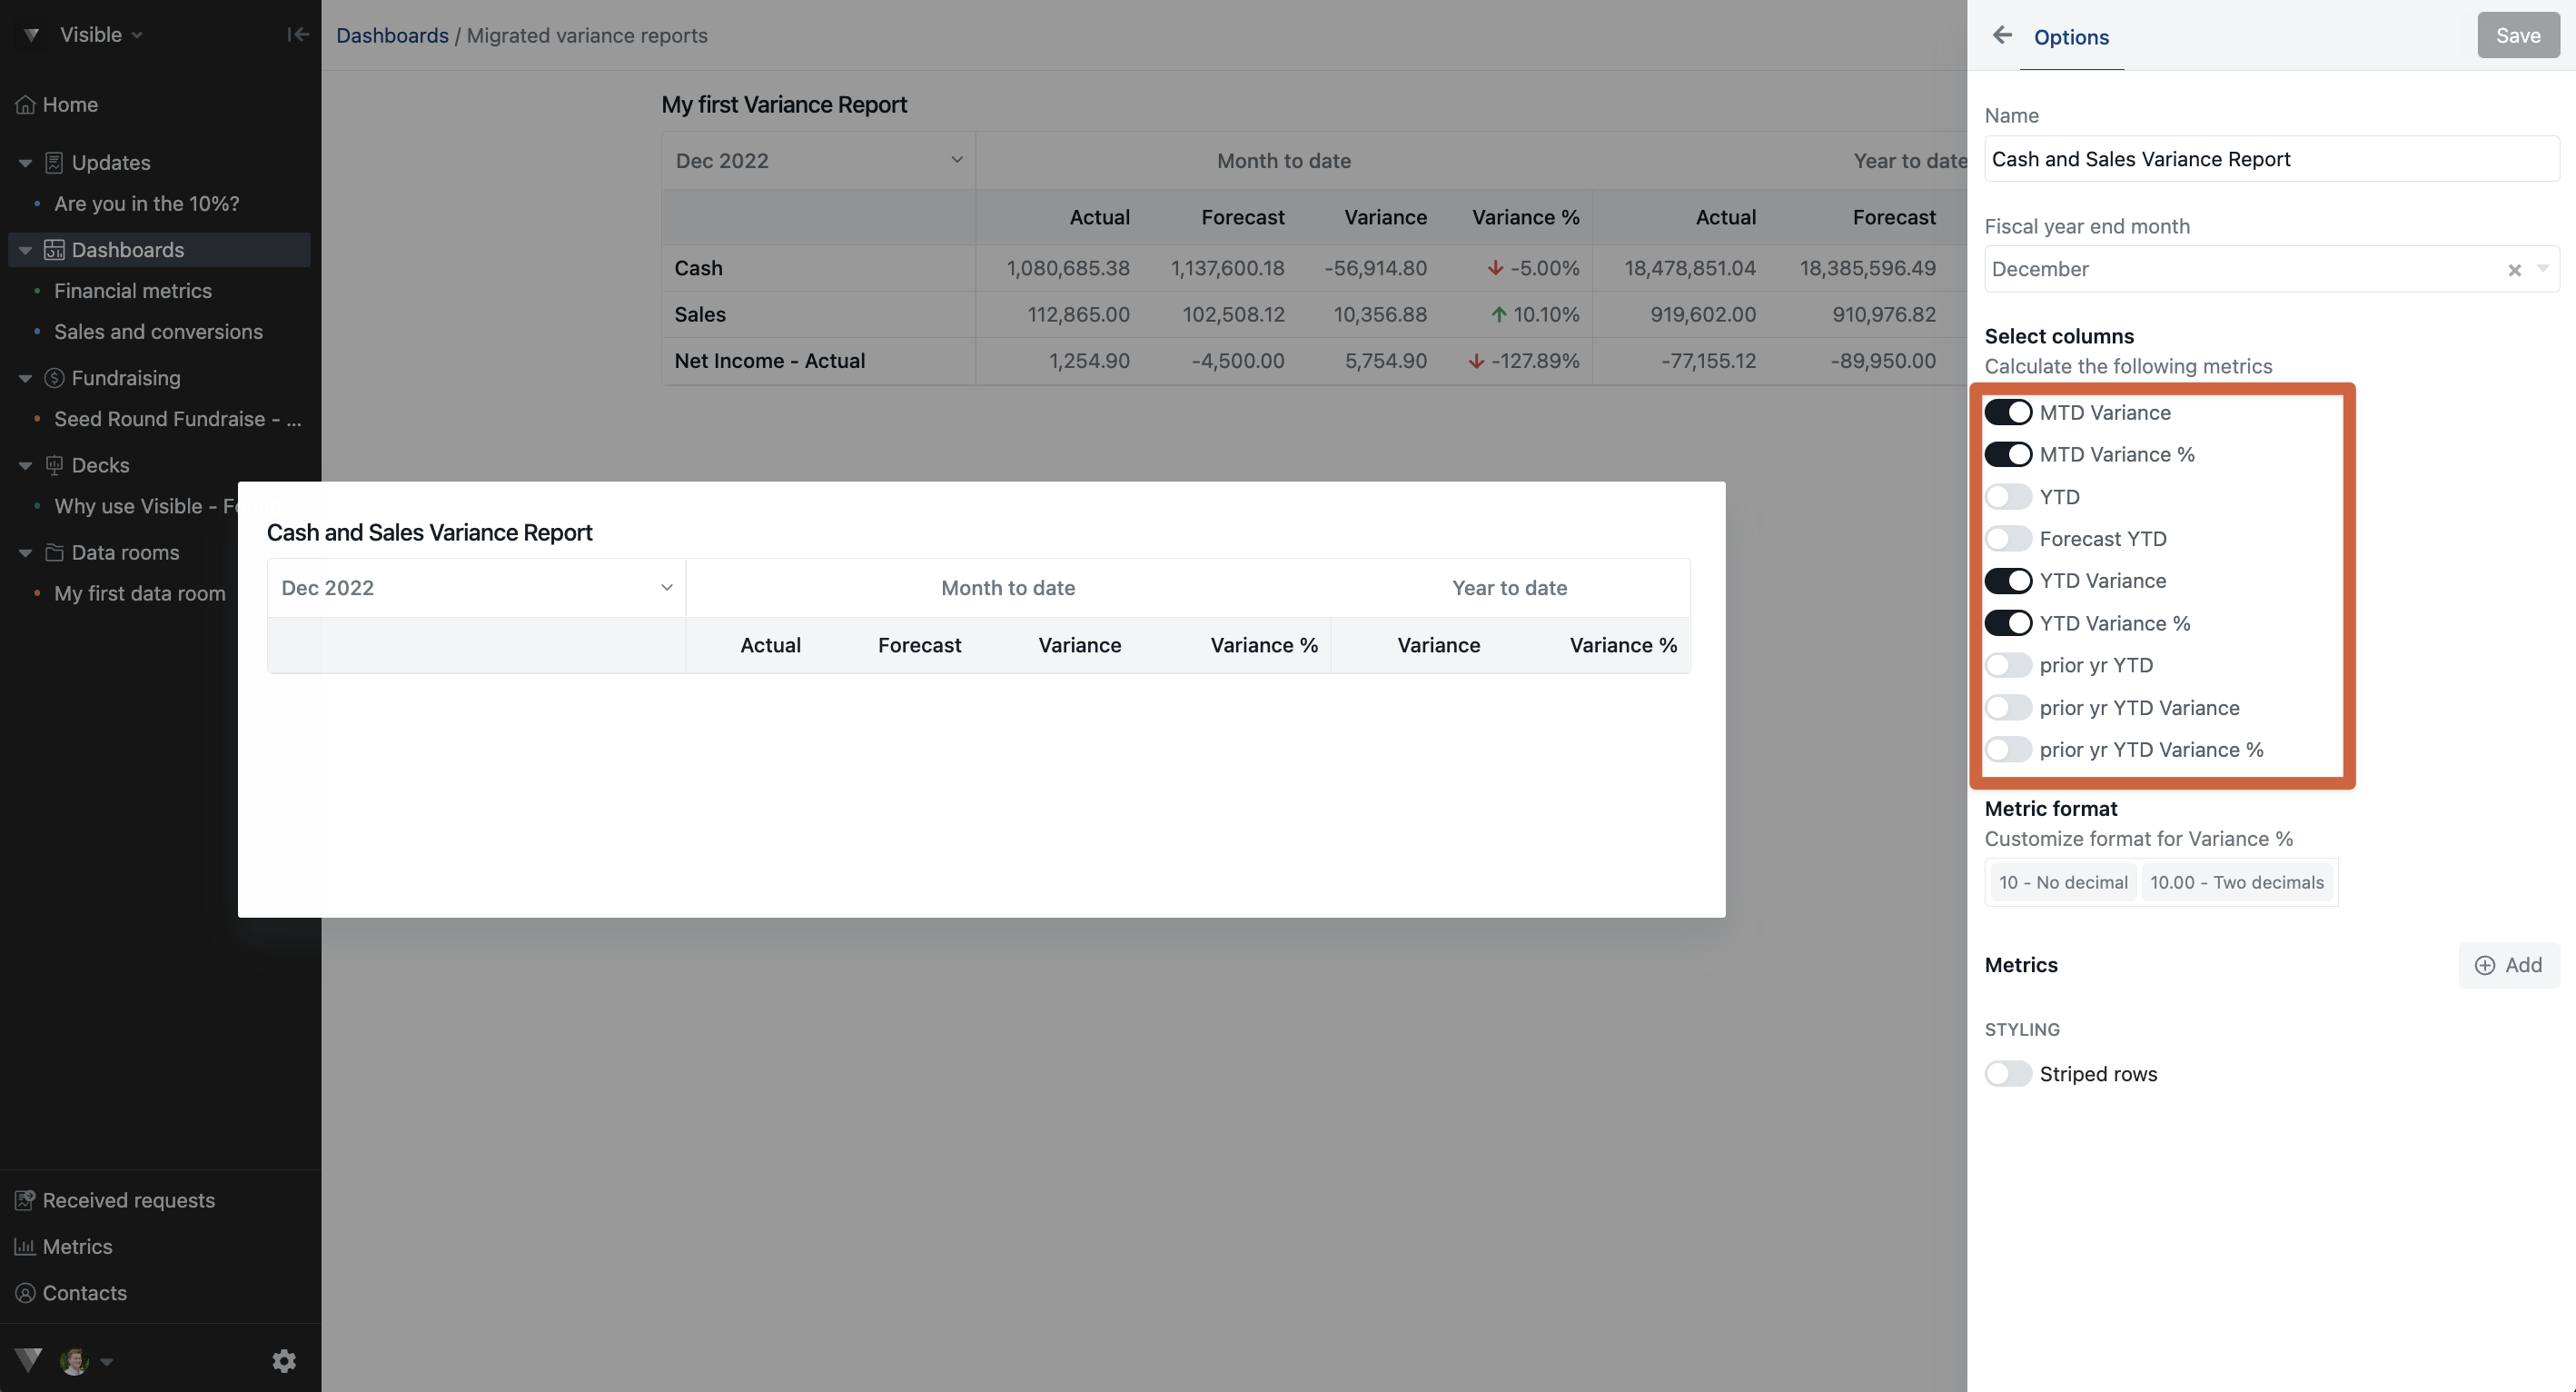
Select the respective metrics you wish to calculate:
-
MTD Variance
-
MTD Variance %
-
YTD Actual
-
YTD Variance
-
YTD Variance %
-
YTD Actual
-
prior yr YTD Actual
-
prior yr YTD Variance
-
prior yr YTD Variance %
-
- Format your % metrics decimal places
- Style your rows by striping them
Name your Variance report
The metric you select in the top right will be the Forecast metric. By clicking 'Select forecast or budget metrics', you will be able to select the budget metric.
Select the metrics you want to pull from
Choose your data's fiscal year end
Toggle on the the metrics you wish shown and measured
Add metrics you wish to measure
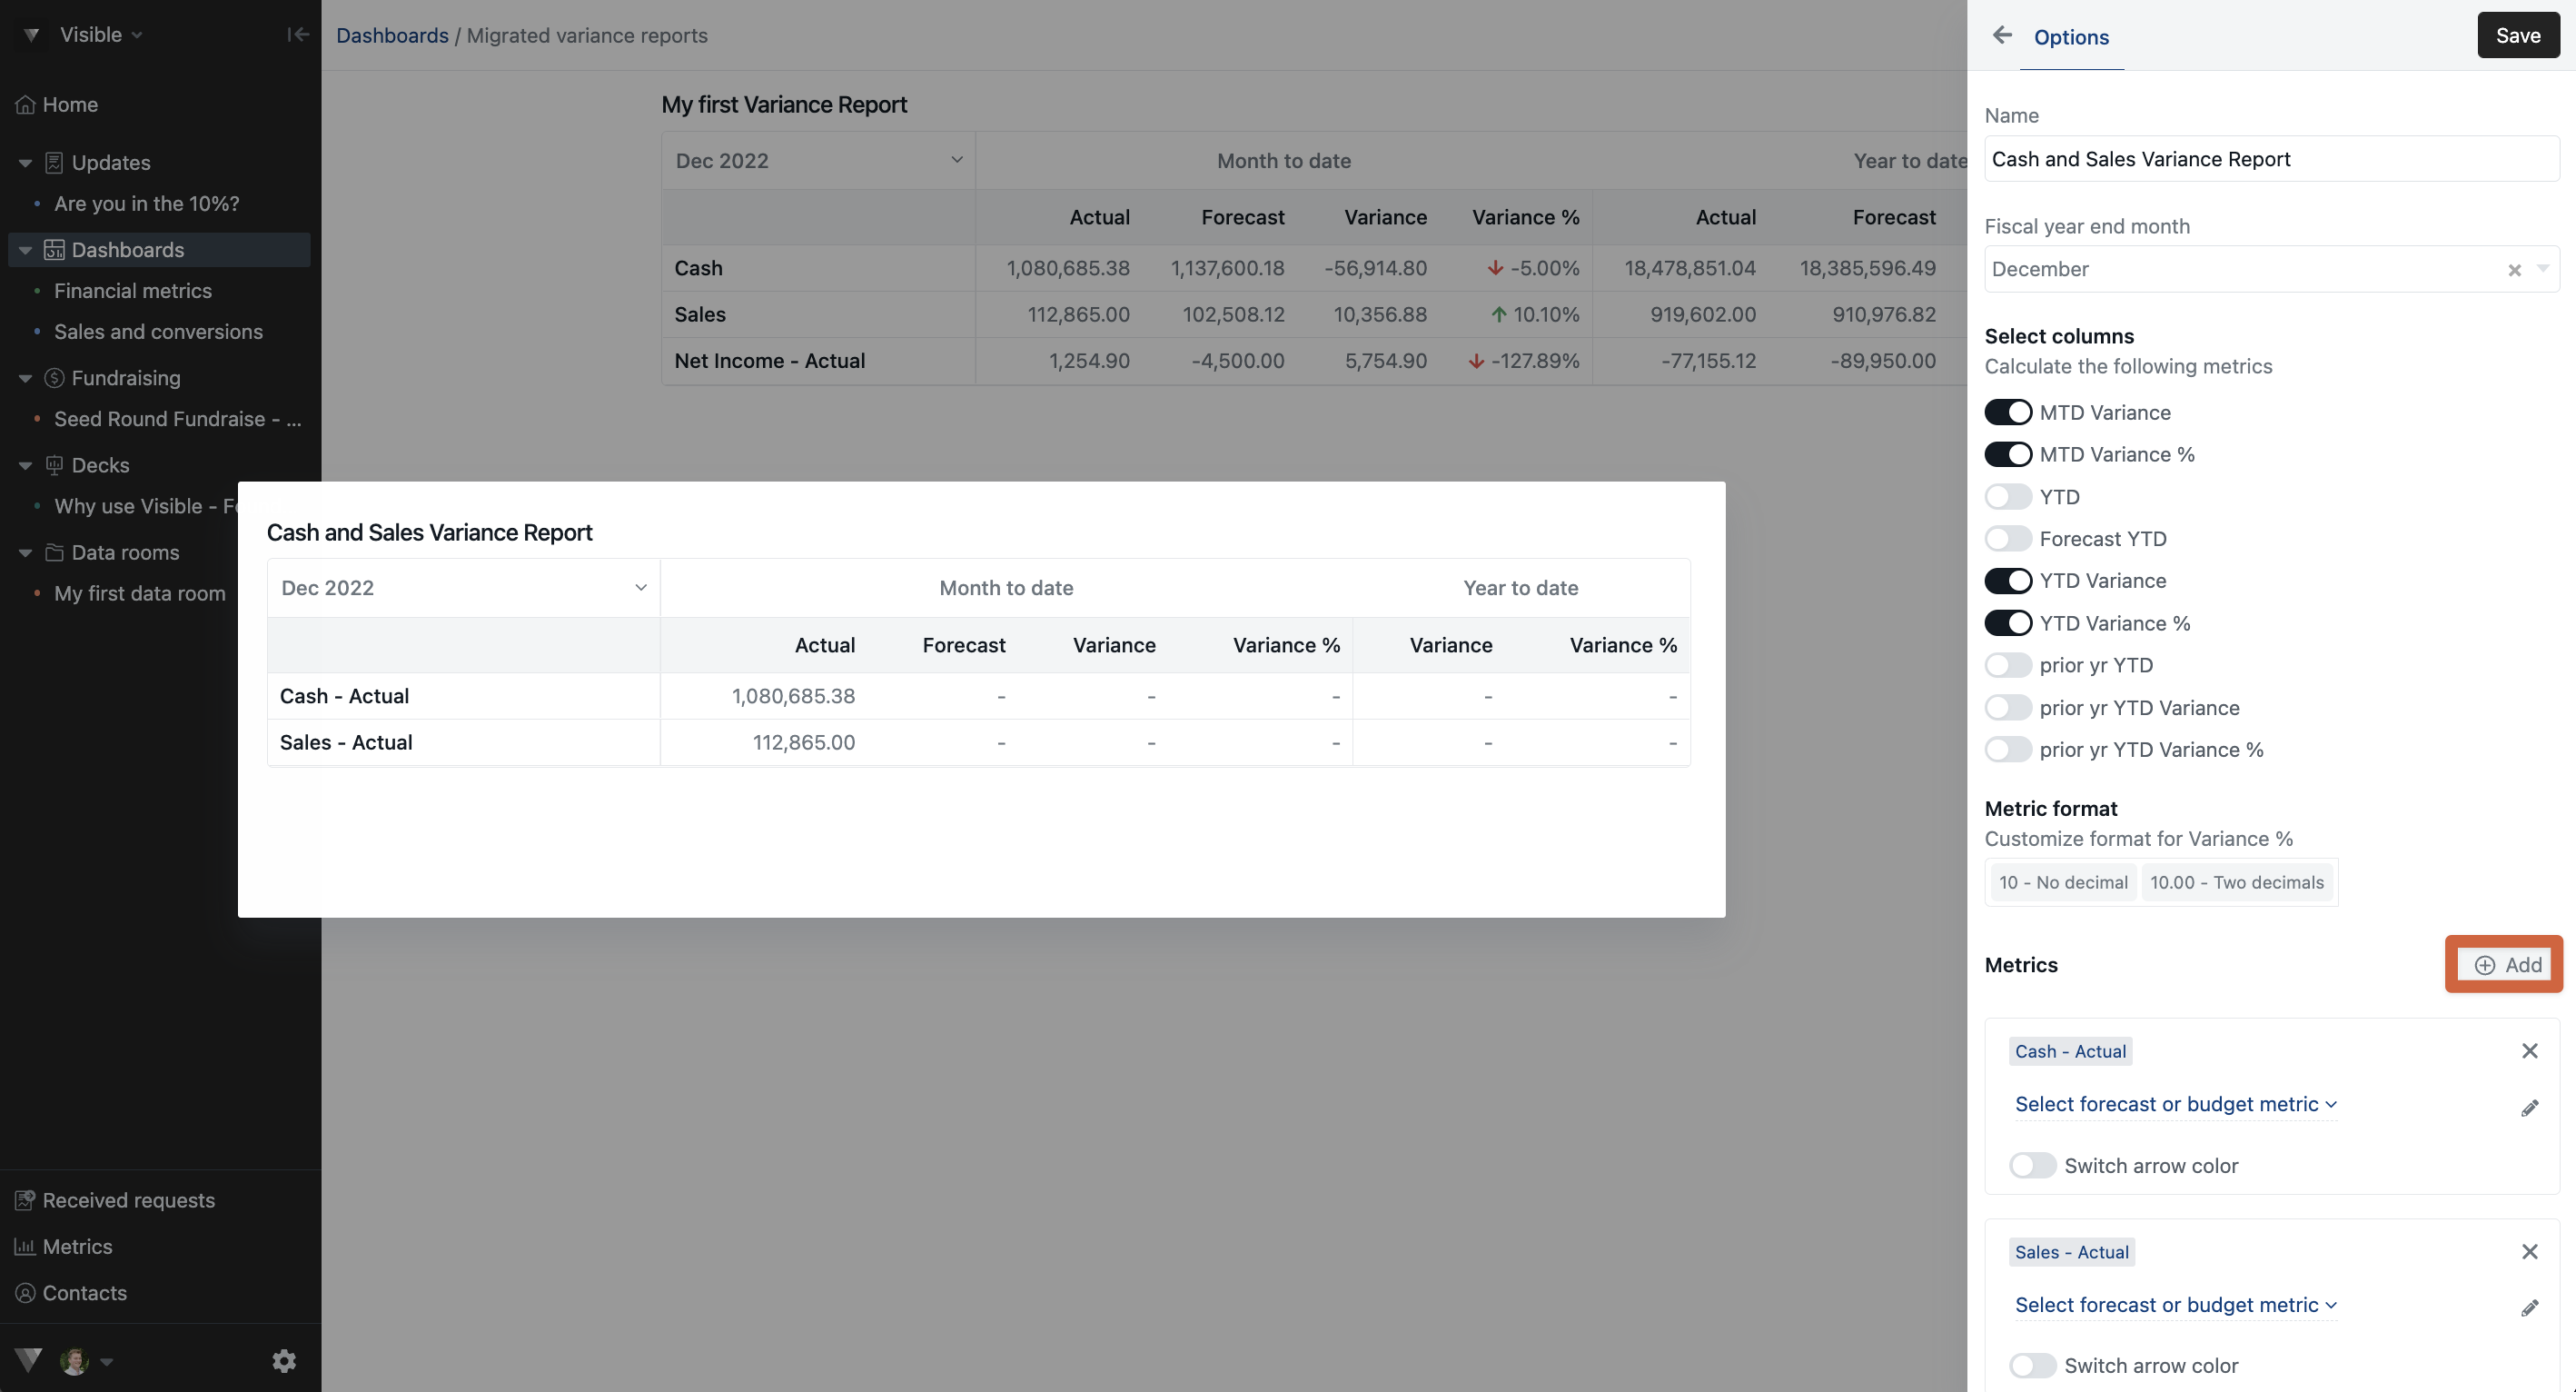
Select the metric you wish it to be measure against
Click Save in the top right of your Variance report builder when you are done
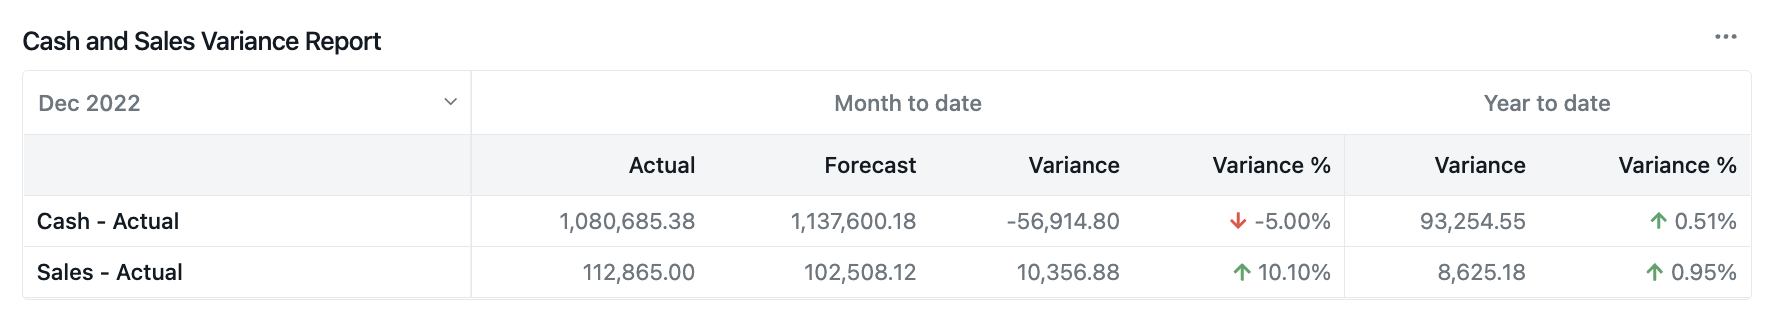
See below a screenshot of a finished variance report!
Make a copy of an example google sheet to use to build your first variance report.
Variance reports can be confusing. Please reach out to our team if you have questions!