
Comparing budgets vs. actuals
We created Variance Reports so you can get a more granular understanding of your portfolio companies' performance. Within Visible, you can create two different types of Variance Reports, located in two different places within the platform:
- Portfolio Variance Reports -- for analyzing the performance of multiple companies or aggregate figures -- located within Dashboards on the left of your screen.
- Company-specific Variance Reports -- for analyzing the performance of one company -- located on a company's profile.
Continue reading below for instructions on how you can make each type of variance report.
Portfolio Variance Reports
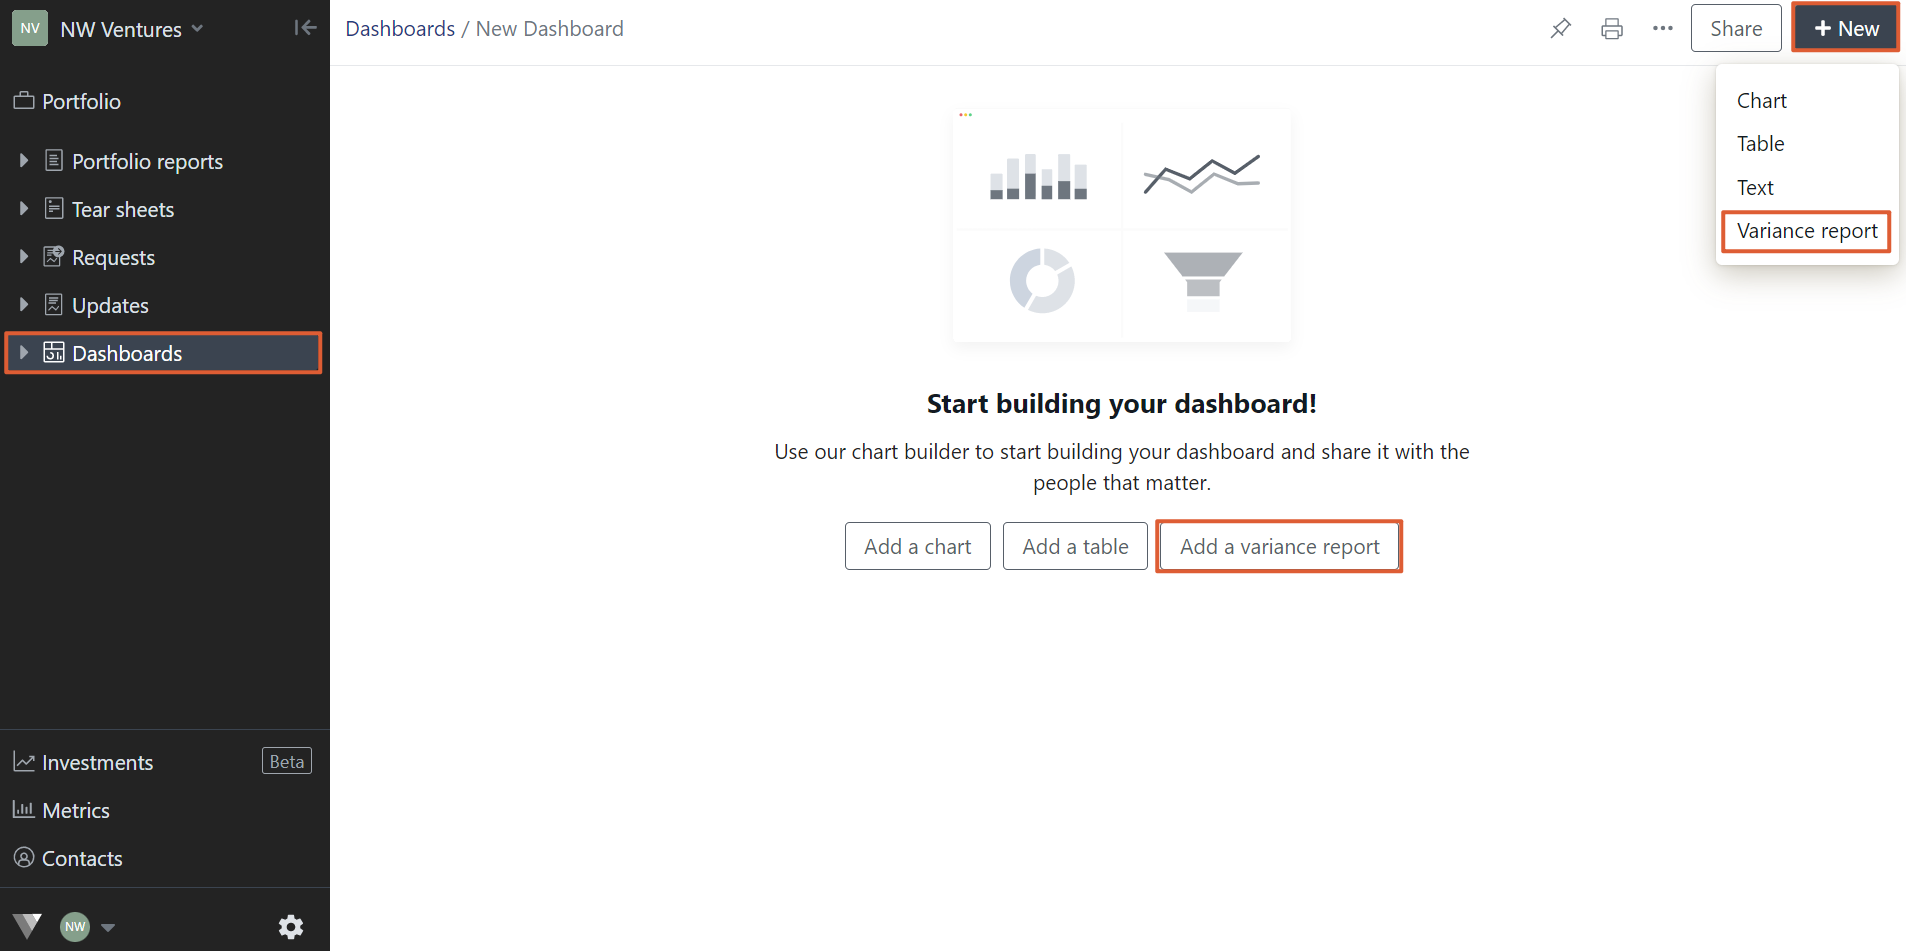
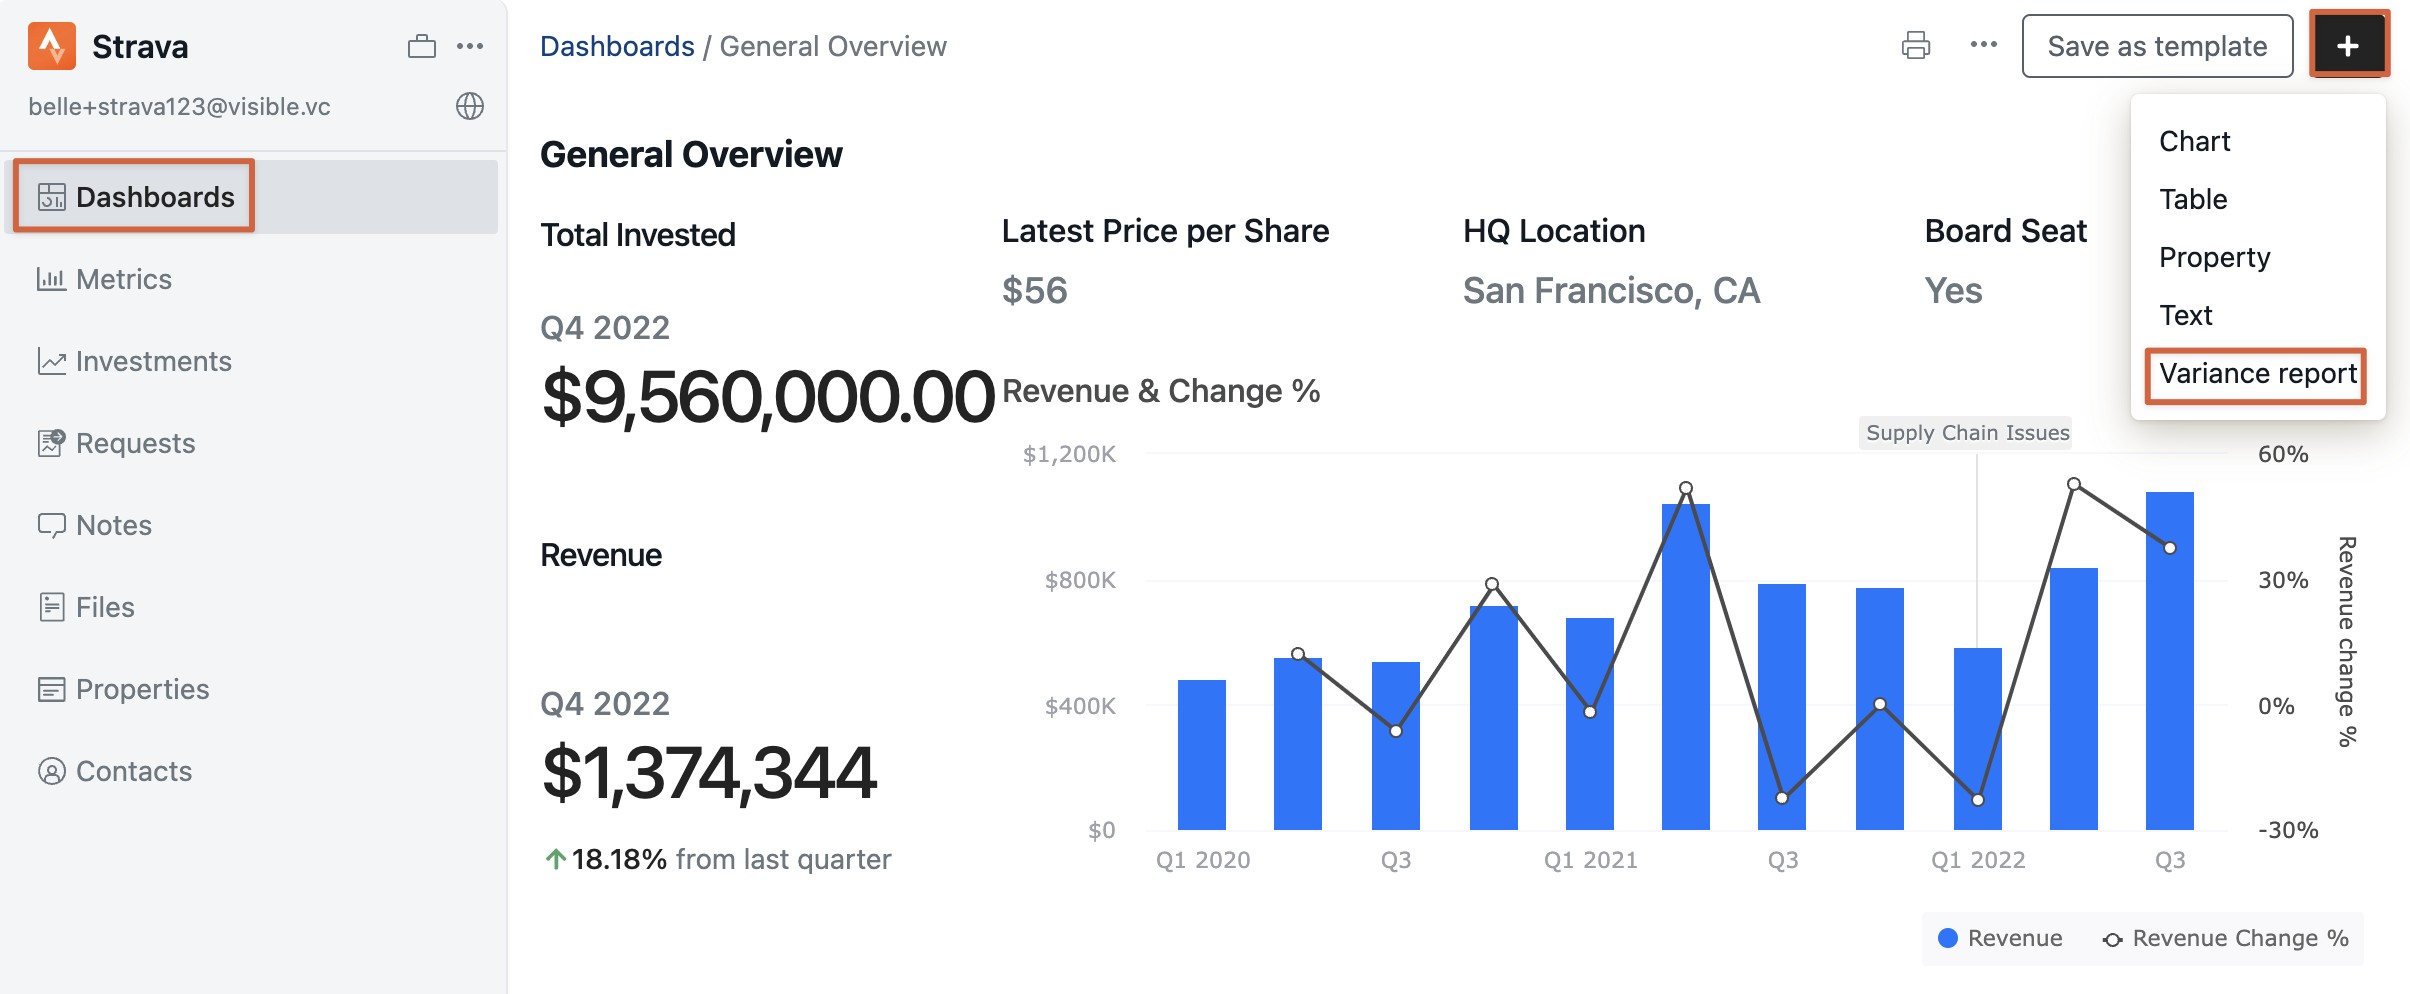
To create a portfolio variance report, navigate to Dashboards on the left side of your screen. From here, click into the dashboard where you want to add a Variance report (or create a new dashboard where you want to add a variance report).
Select +New located in the top right followed by Variance report. If it's a new, blank dashboard, you are also given the option to add a variance report using the chart builder shown in the middle of the screen.
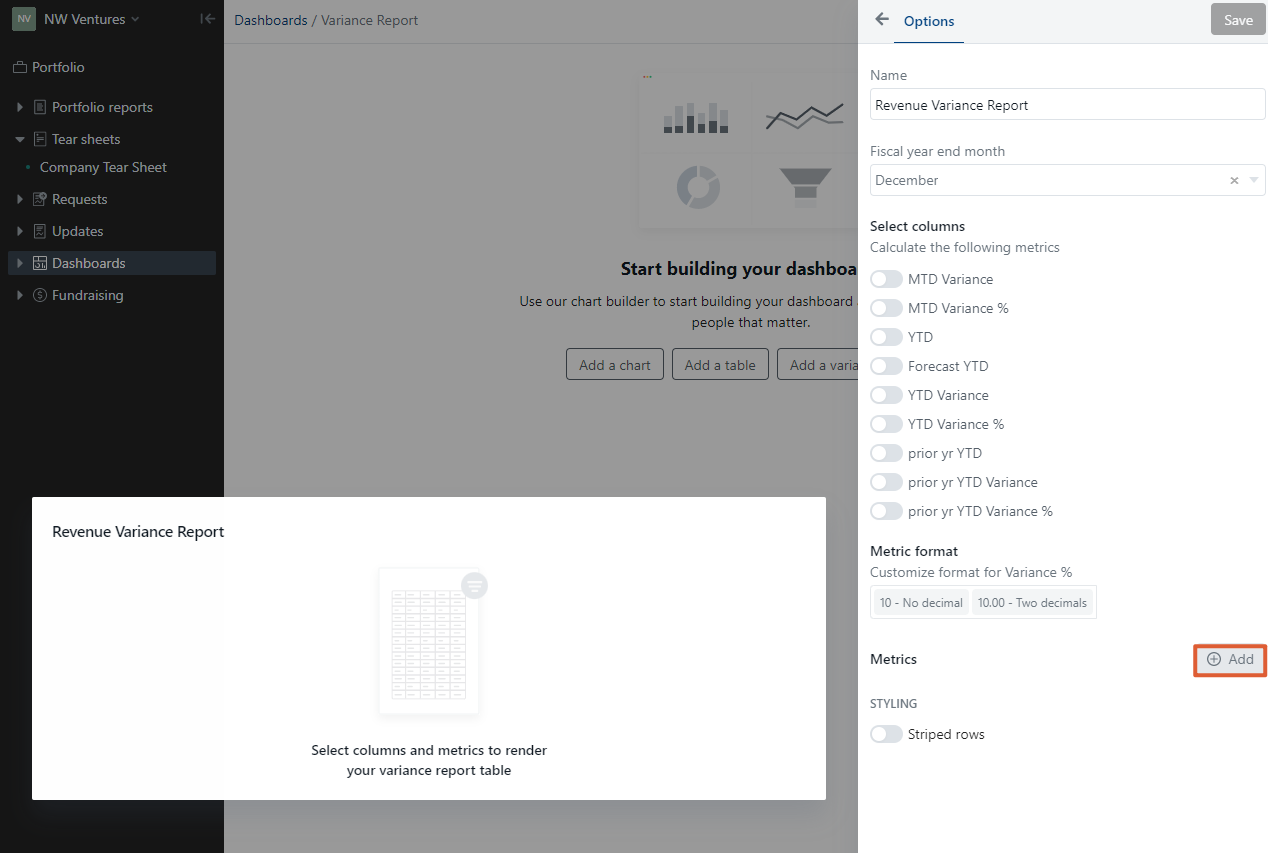
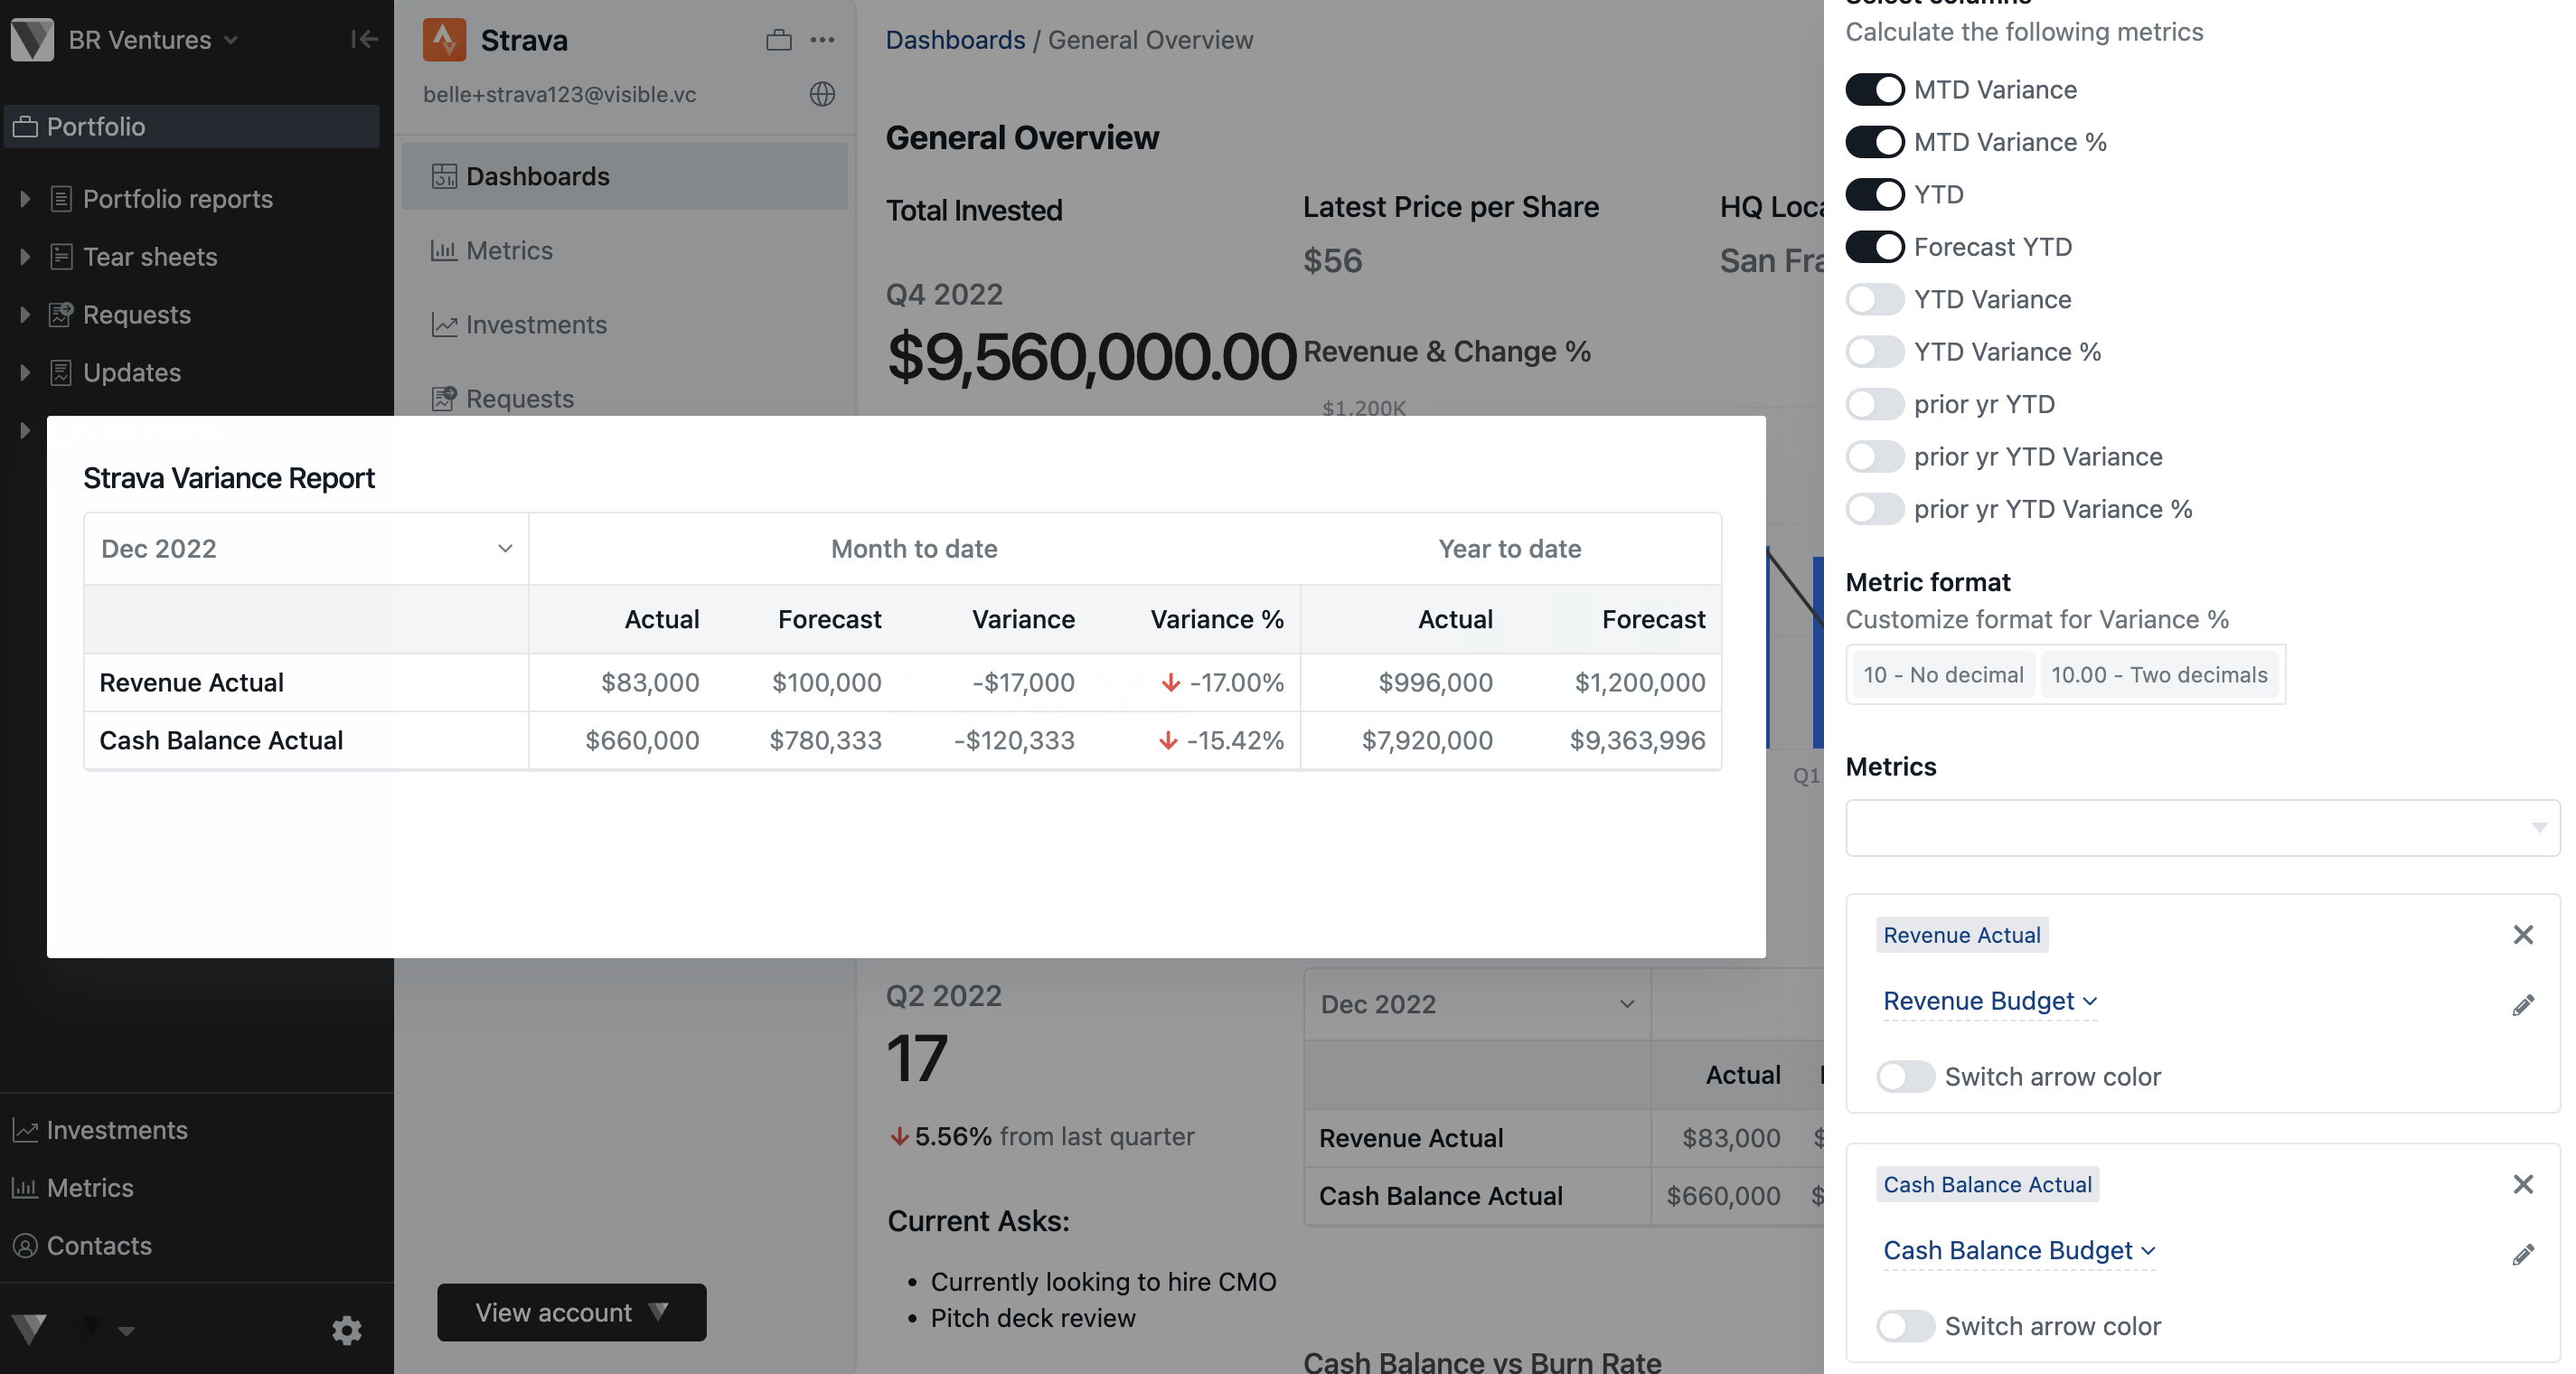
Next, name your variance report, choose the fiscal year-end month, choose the variance calculations you want to display, and choose your budget and actual figures.
To add a variance metric, click +Add and then select your metric from the drop-down.
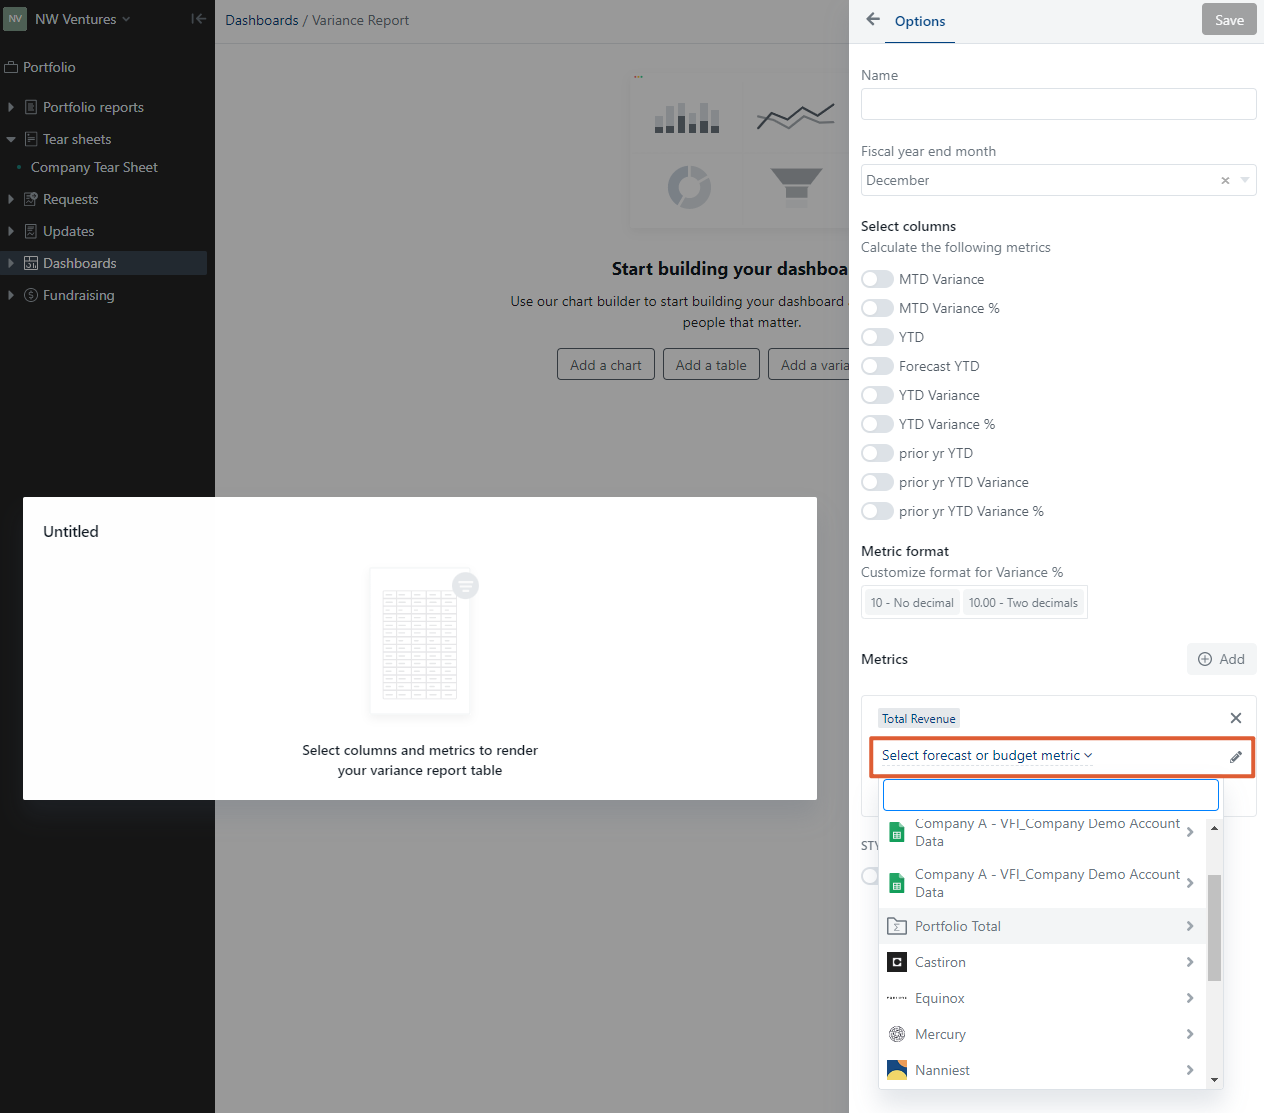
Then click the drop-down titled Select forecast or budget metric to add your other metric.
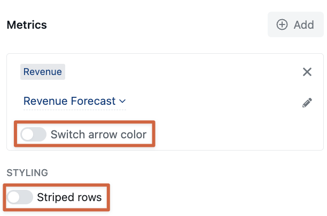
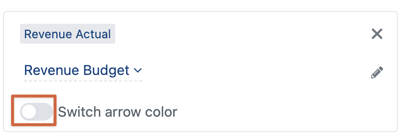
Note: You can customize the arrow color associated with your variance % and style your report to have striped rows.
Select Save and this chart will be added to your dashboard.
Company-specific Variance Reports
To create a company-specific variance report, navigate to Portfolio on the left side of your screen. From here, click the respective company's name followed by Dashboards from the inner left side pane.
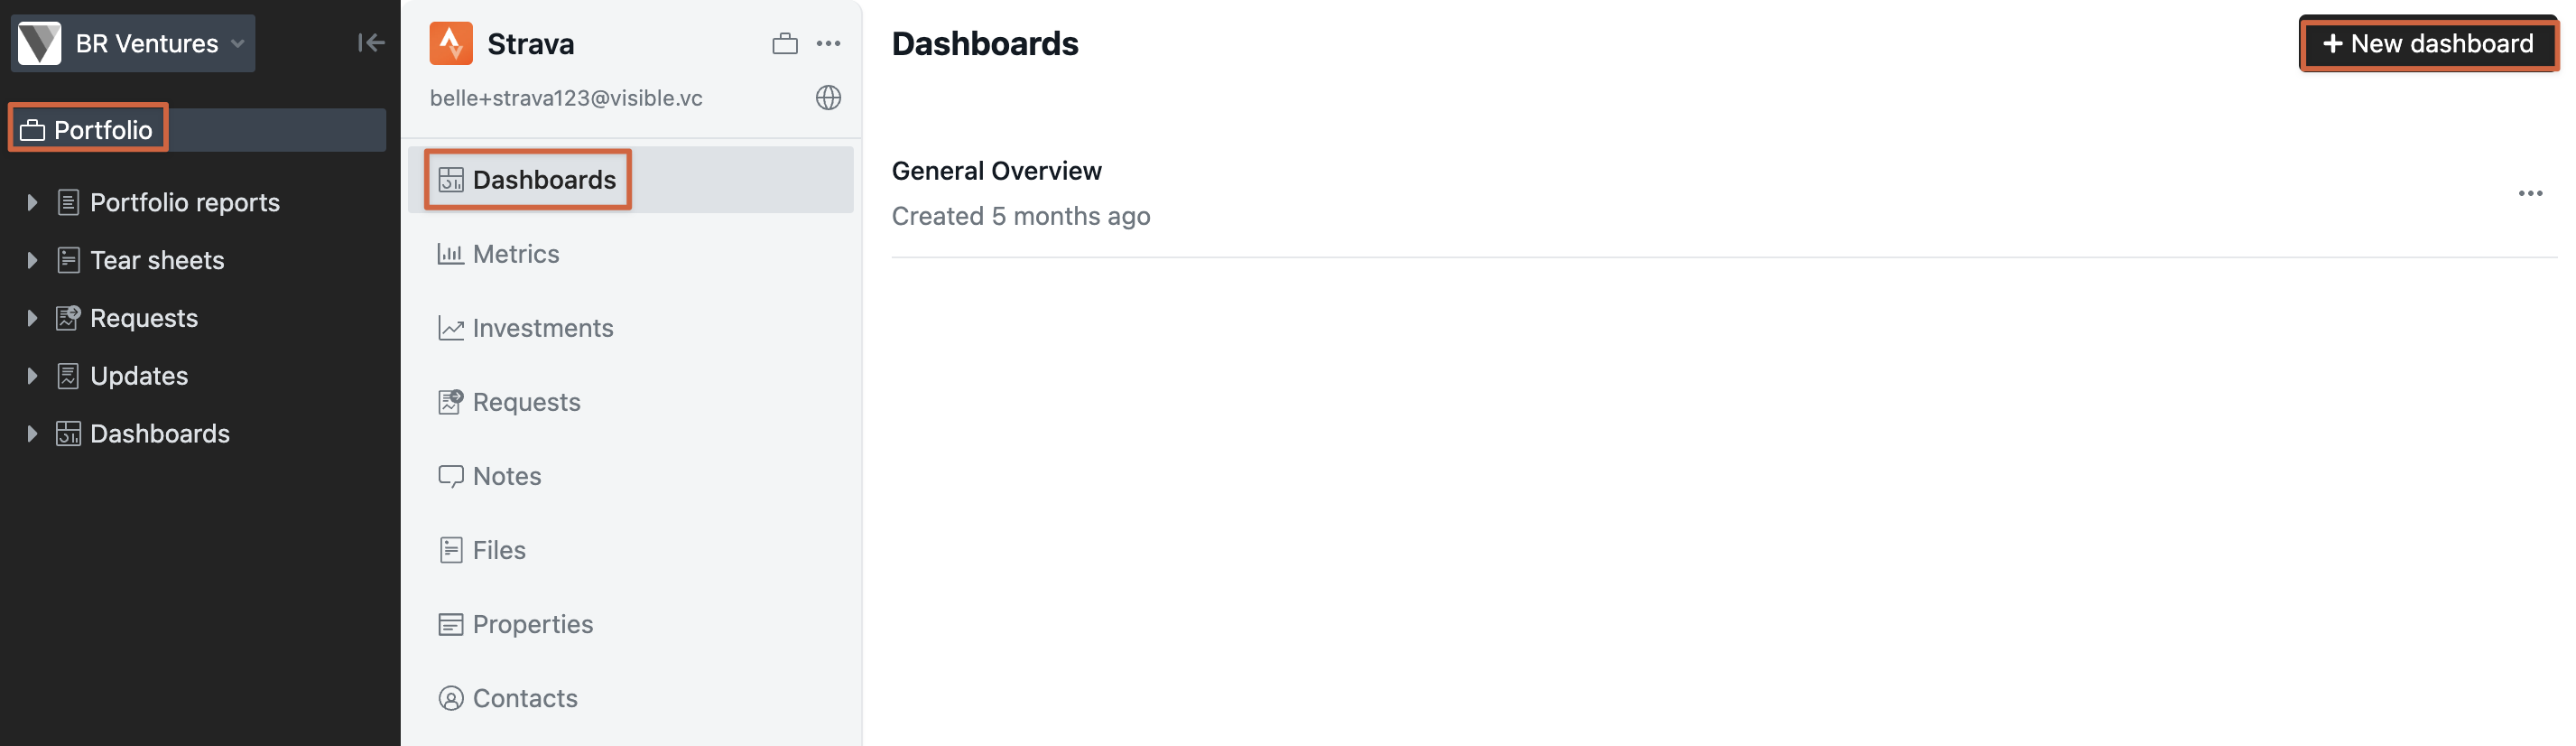
Next, click +New dashboard followed by Add a variance report (or click into an already created dashboard to add to it as shown below).
Select the appropriate actual and budget metrics to include in the variance report. Use the toggles underneath Select columns to pull the relevant columns into view. Click Save when done.
To change the color of the variance % arrows, toggle on or off Switch arrow color as shown below.
Note: Only monthly metrics are supported in variance reports.
Please let us know if you have additional questions!