
- Knowledge Base & Help Center
- Visible for Investors
- Dashboards and Tear Sheets - For Investors
-
Visible for Companies
-
Visible for Investors
- Getting Started with Visible for Investors
- Metrics - For Investors
- Requests - For Investors
- Reports - For Investors
- Investment Data - For Investors
- Portfolio Company Profiles
- Dashboards and Tear Sheets - For Investors
- Updates - For Investors
- Fundraising - For Investors
- Account Set Up - For Investors
- Exporting Data - For Investors
- How can my portfolio companies use Visible?
- AI Inbox - For Investors
-
Company and User Settings
How to set a date range for your dashboard
Summarizing data for a specific period in a dashboard
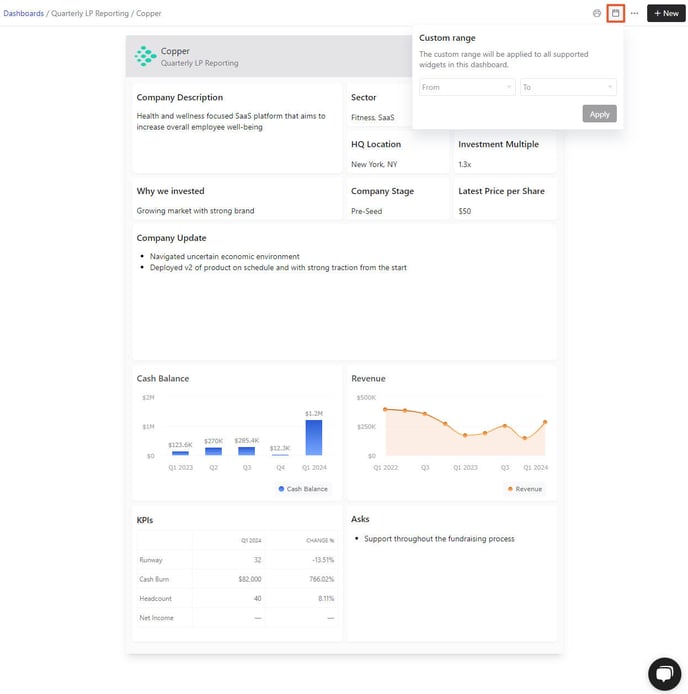
Start by opening the dashboard you want to visualize for a specific period. In the dashboard, click the calendar icon to choose a specific range.
Set the range using the from and to drop-downs. Once finished, choose apply to save the settings. 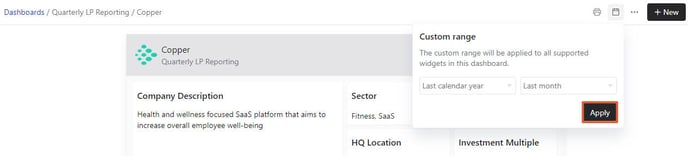
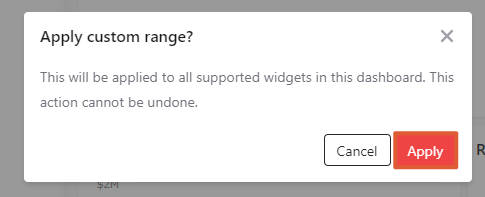
Then choose apply to finish saving the change.
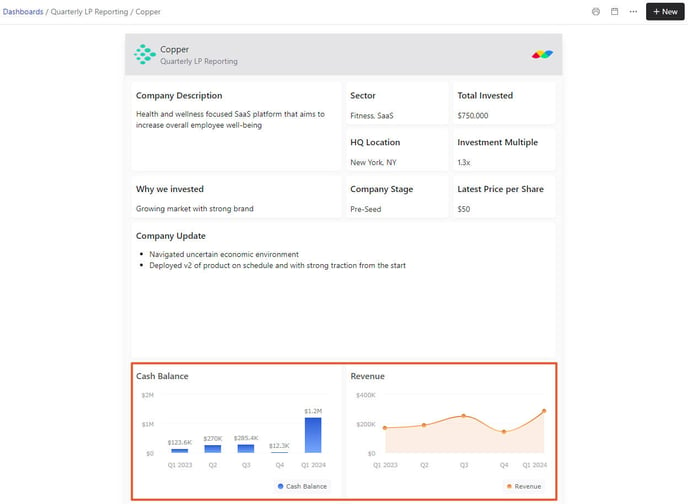
You'll now see the widgets updated to reflect the period that you specified in the settings.
Please let us know if you have additional questions!