
This article will show you how to enable gradient design on your chart
To toggle on chart gradient, open Visible and navigate to the Dashboard where your chart is located. Click on the three dots in the top right of your chart and click Edit, this will open your chart builder. Click on the metric you wish to make a gradient. Next to the color you can choose Color or Gradient. Click Gradient and then Save in the top right.
See screenshots for further directions below.
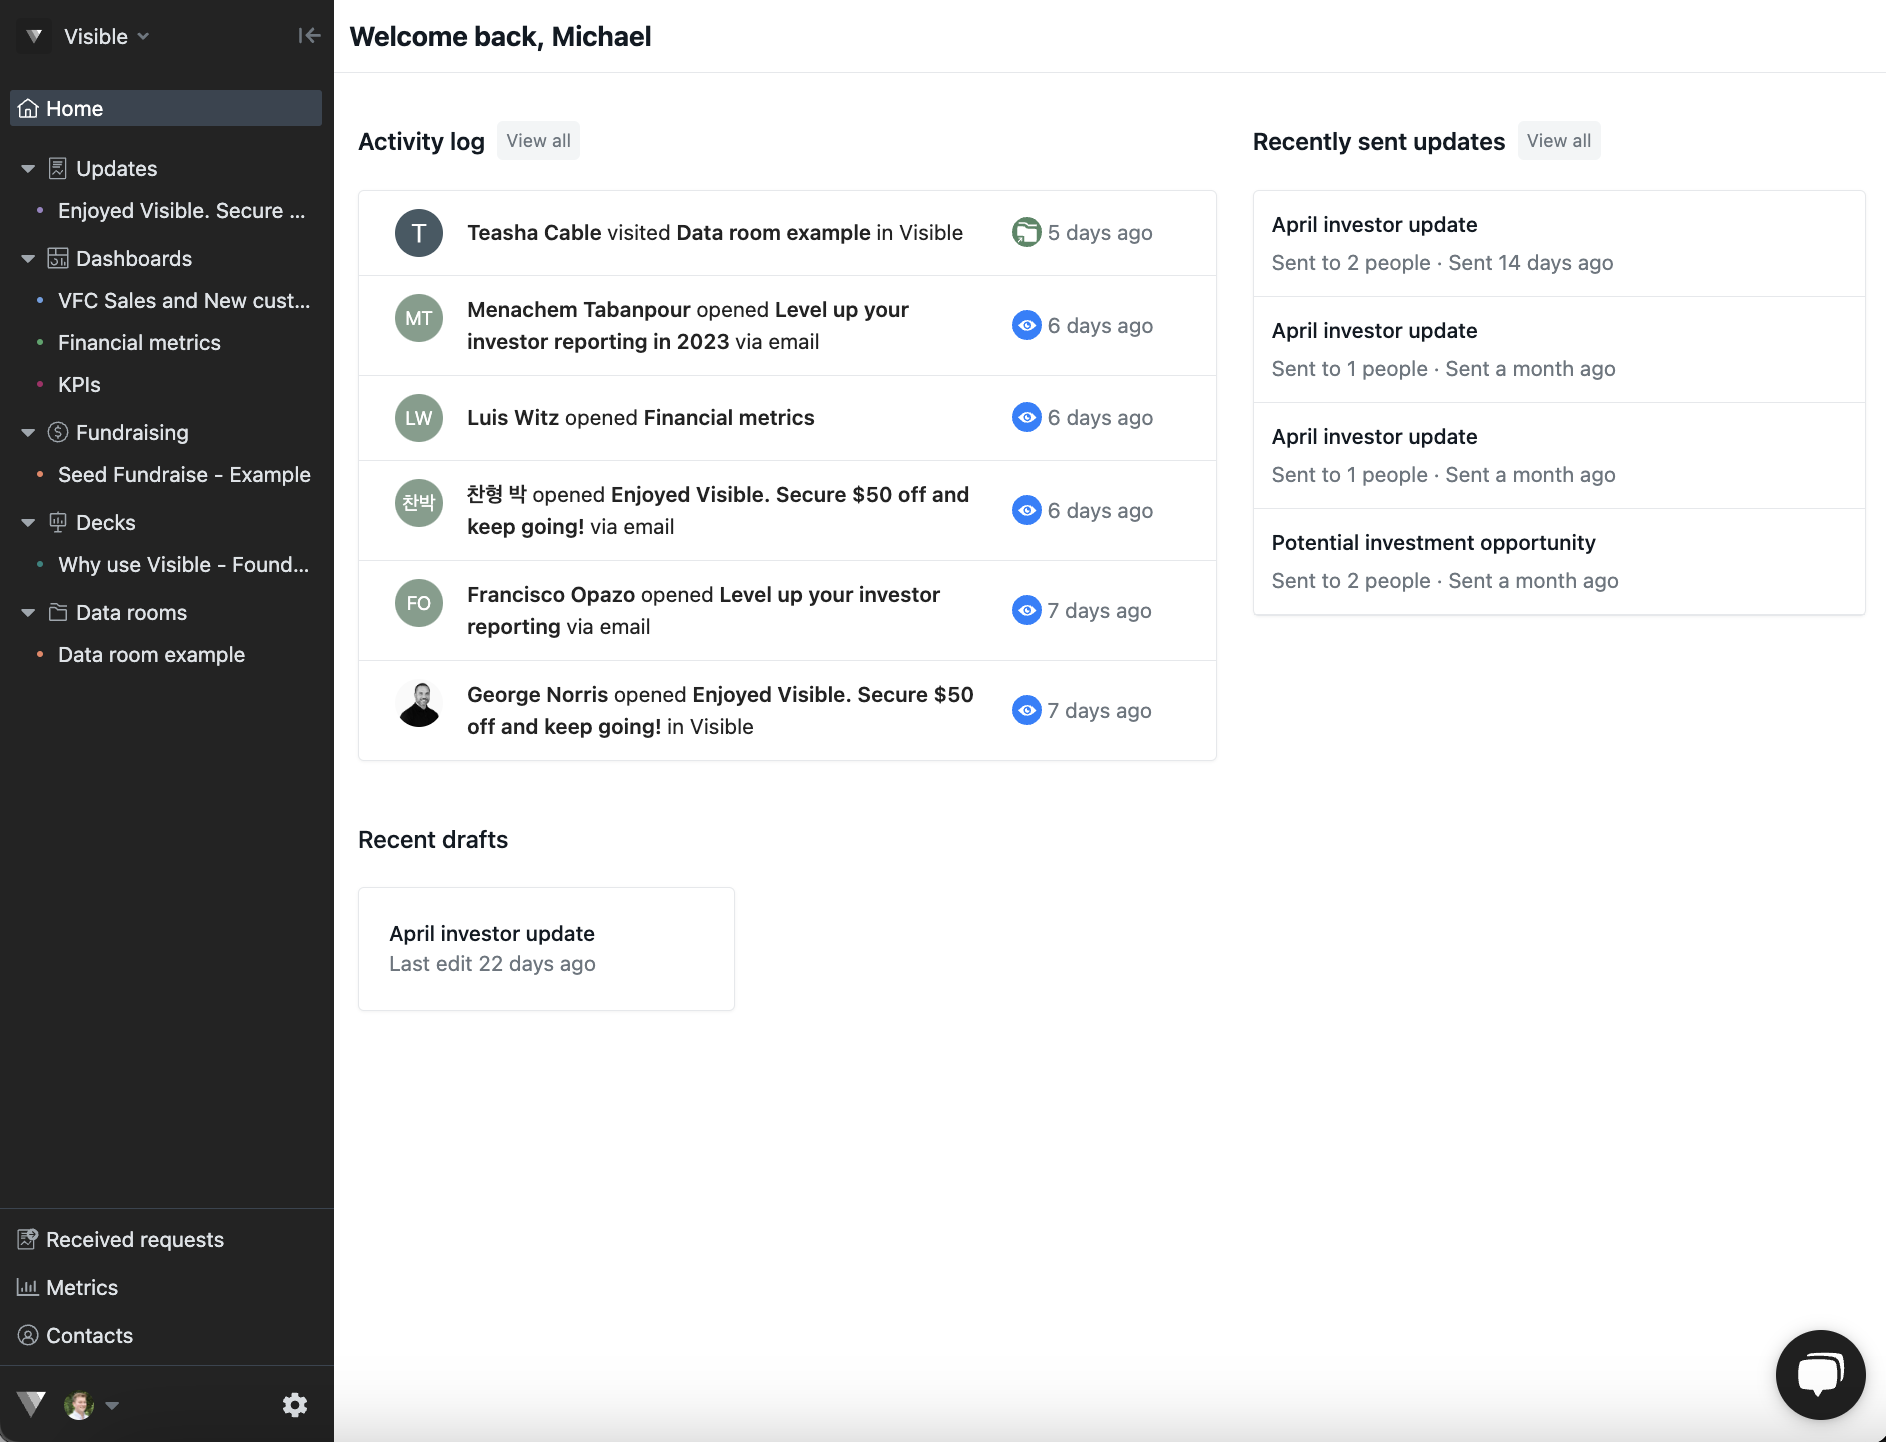
Open Visible
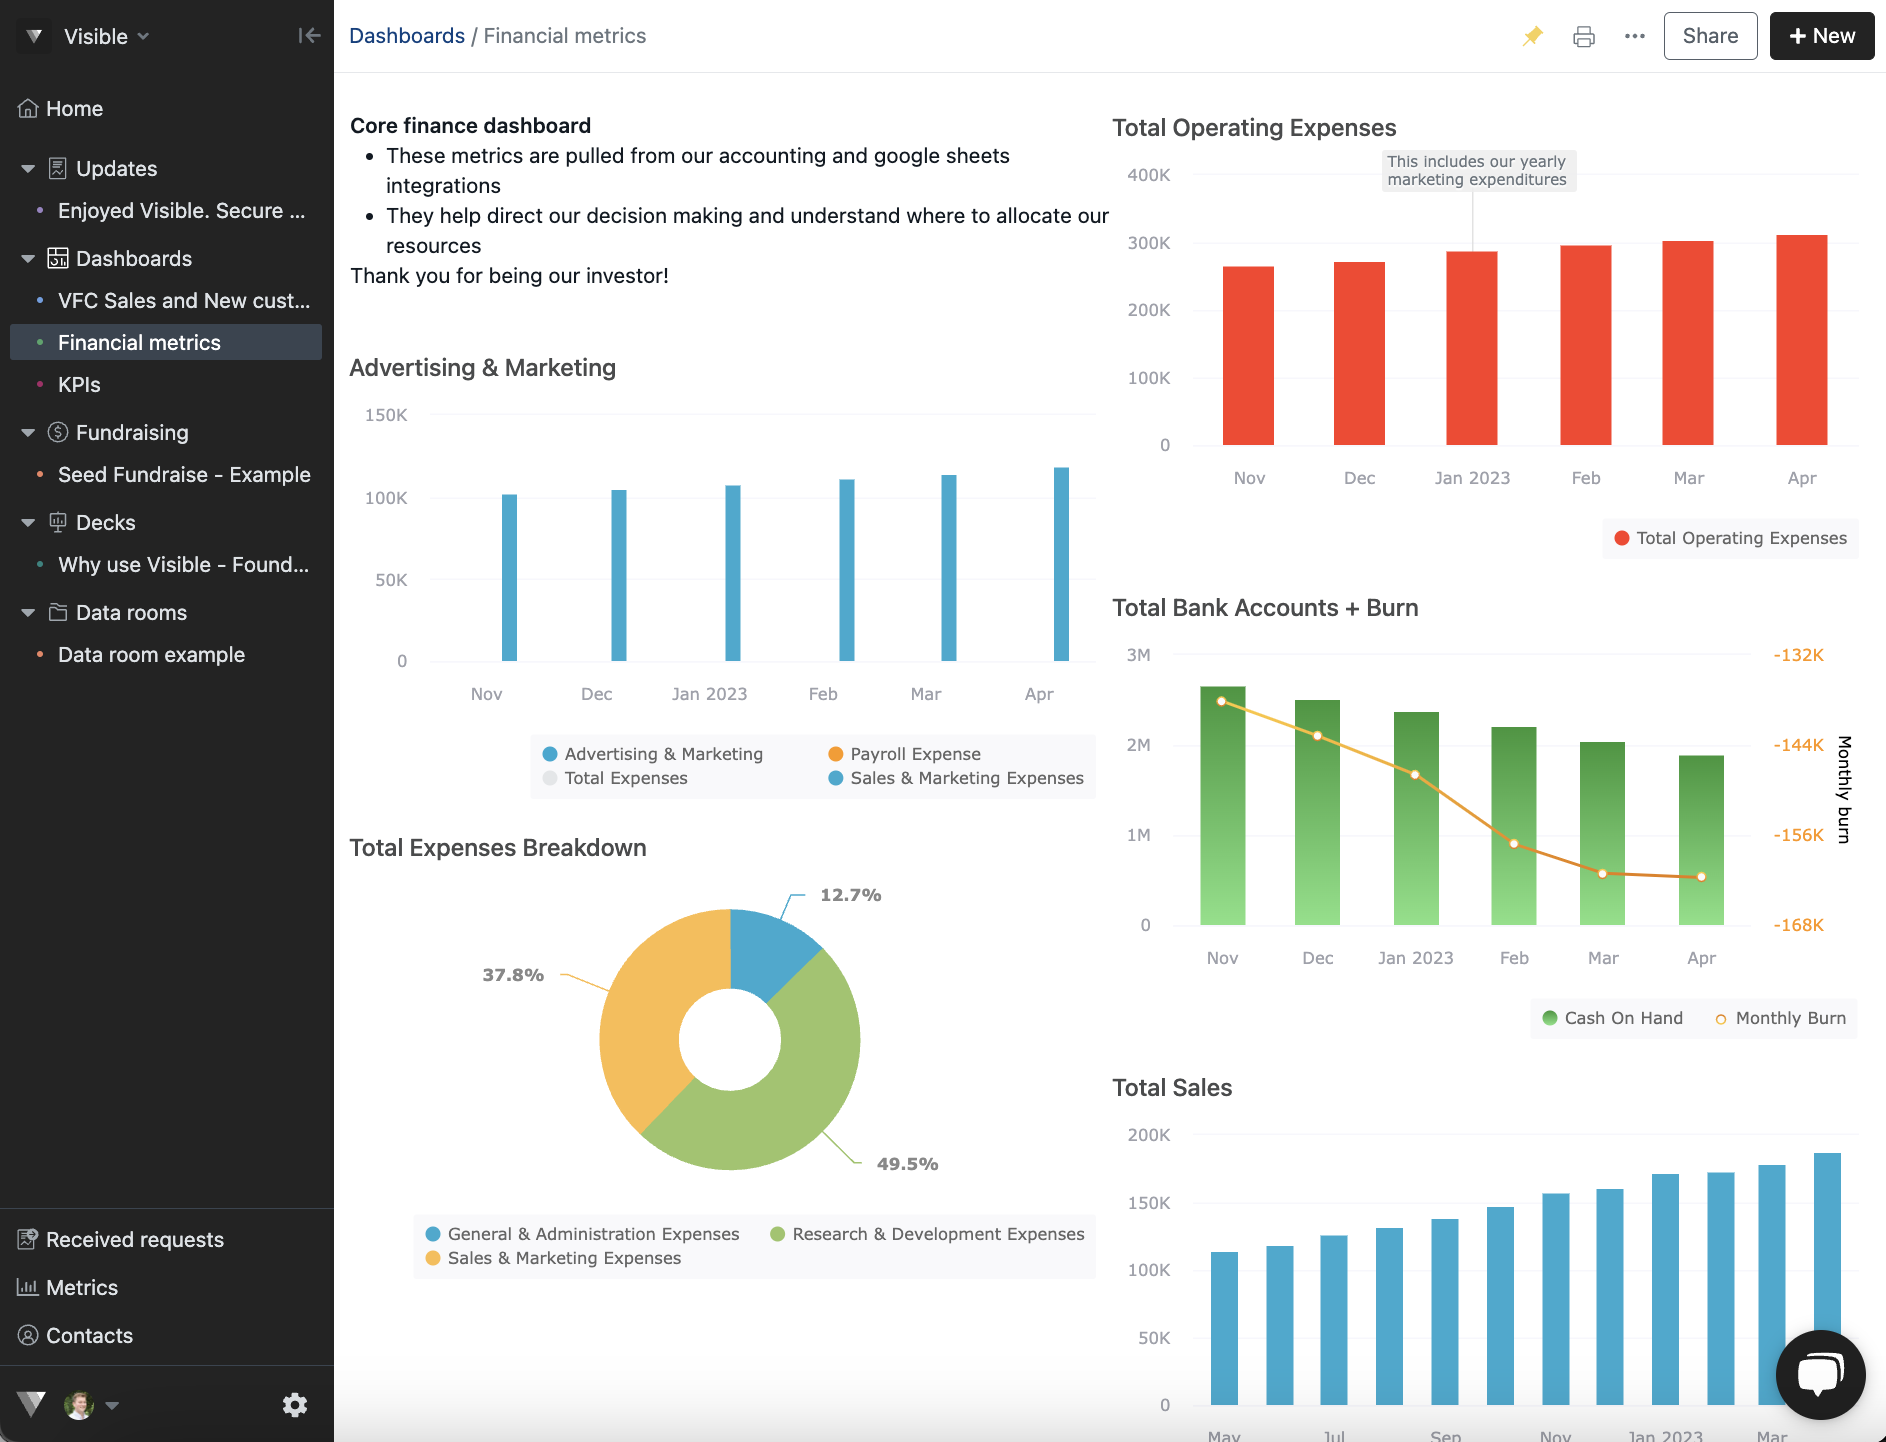
Open the Dashboard where your chart is located
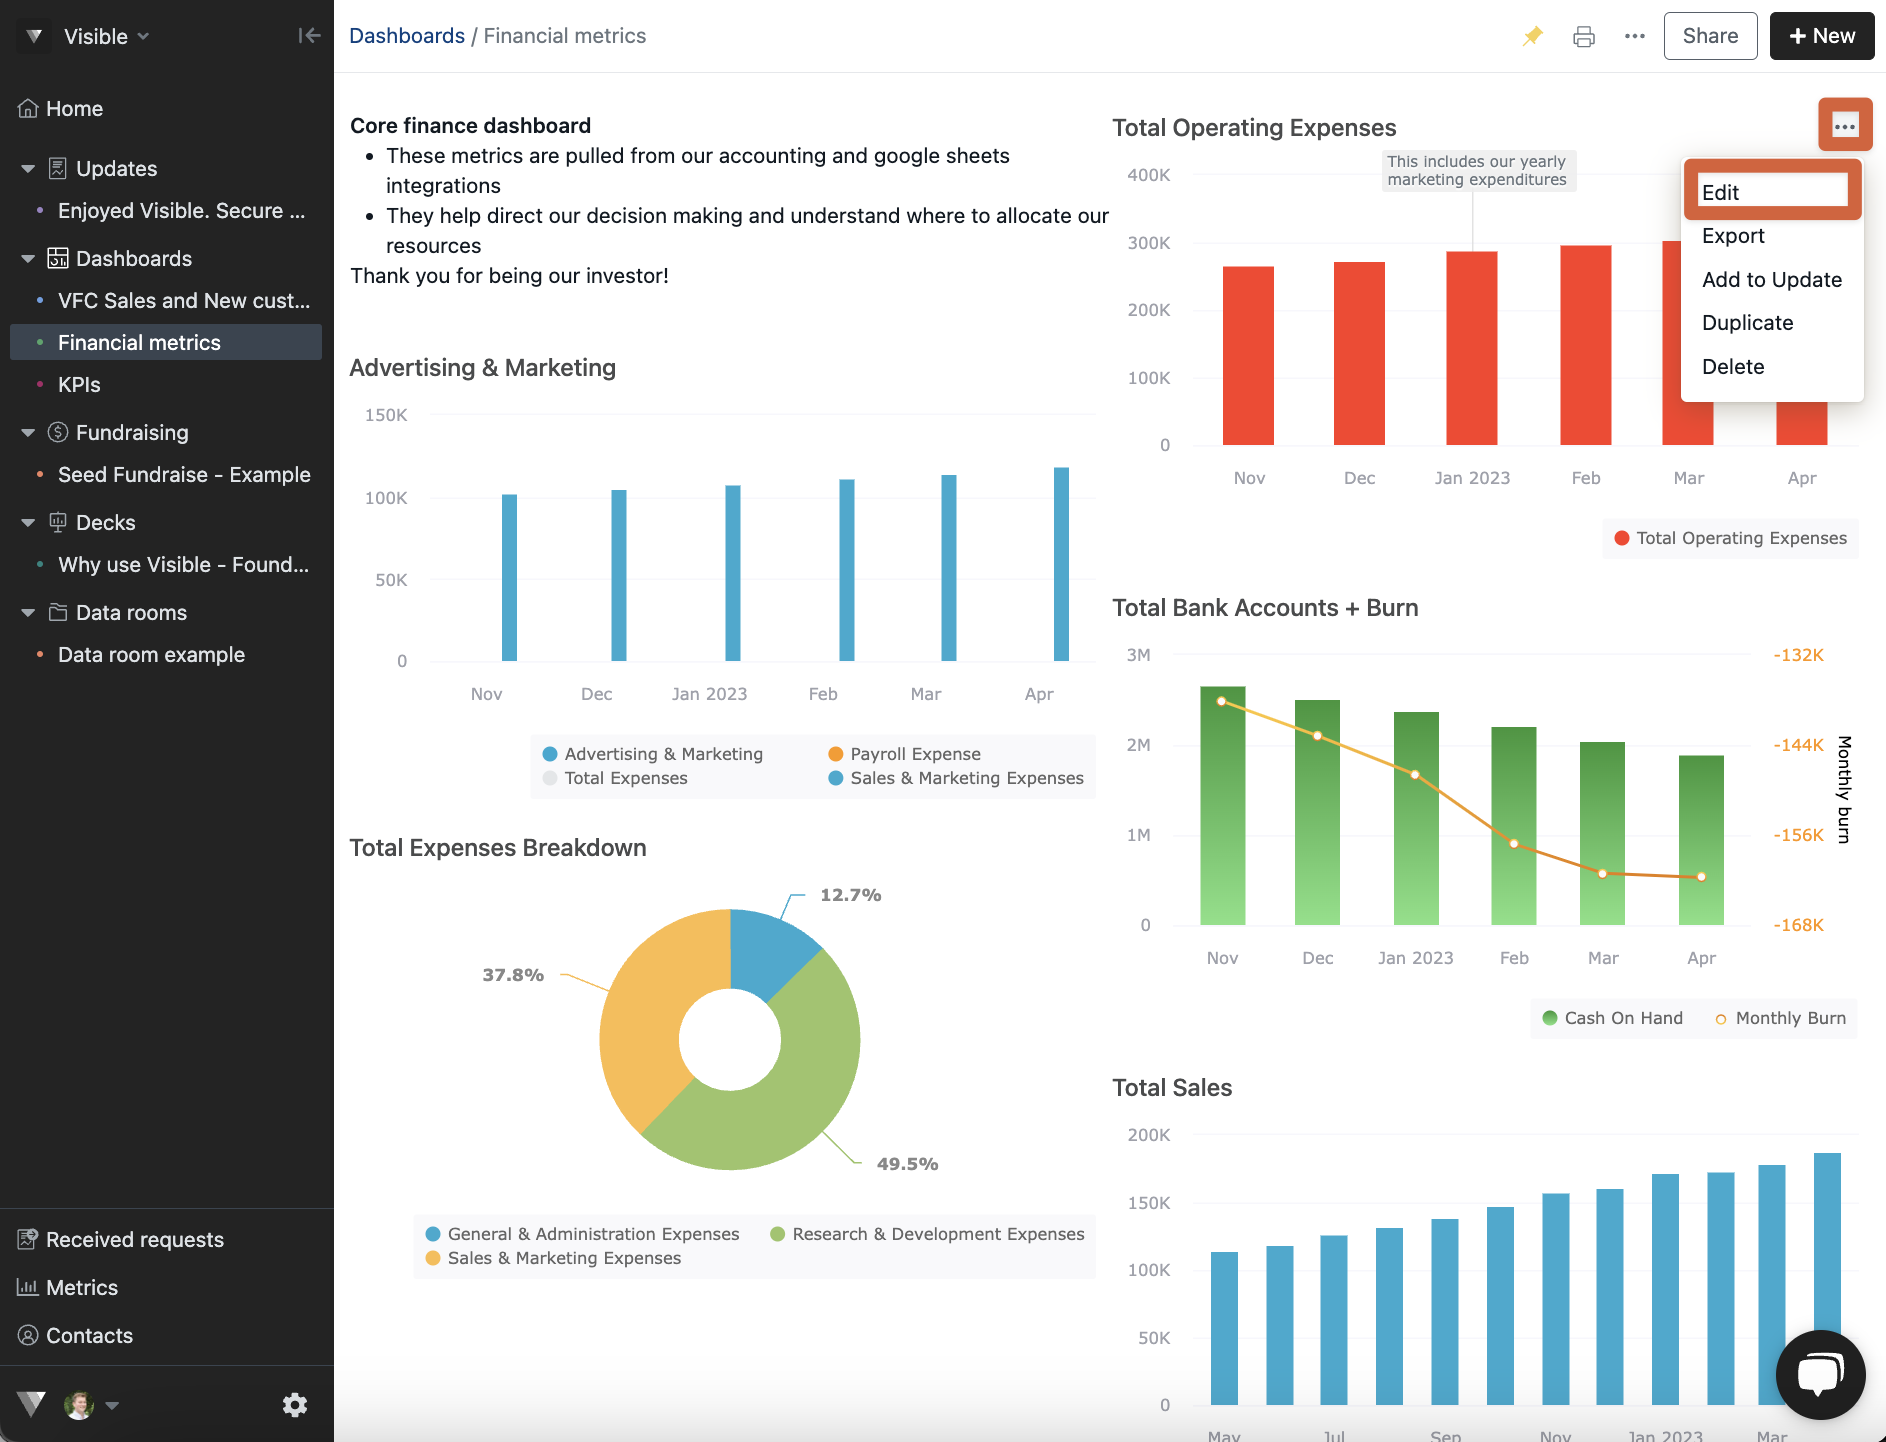
Click the three dots in the top right of your chart and choose Edit
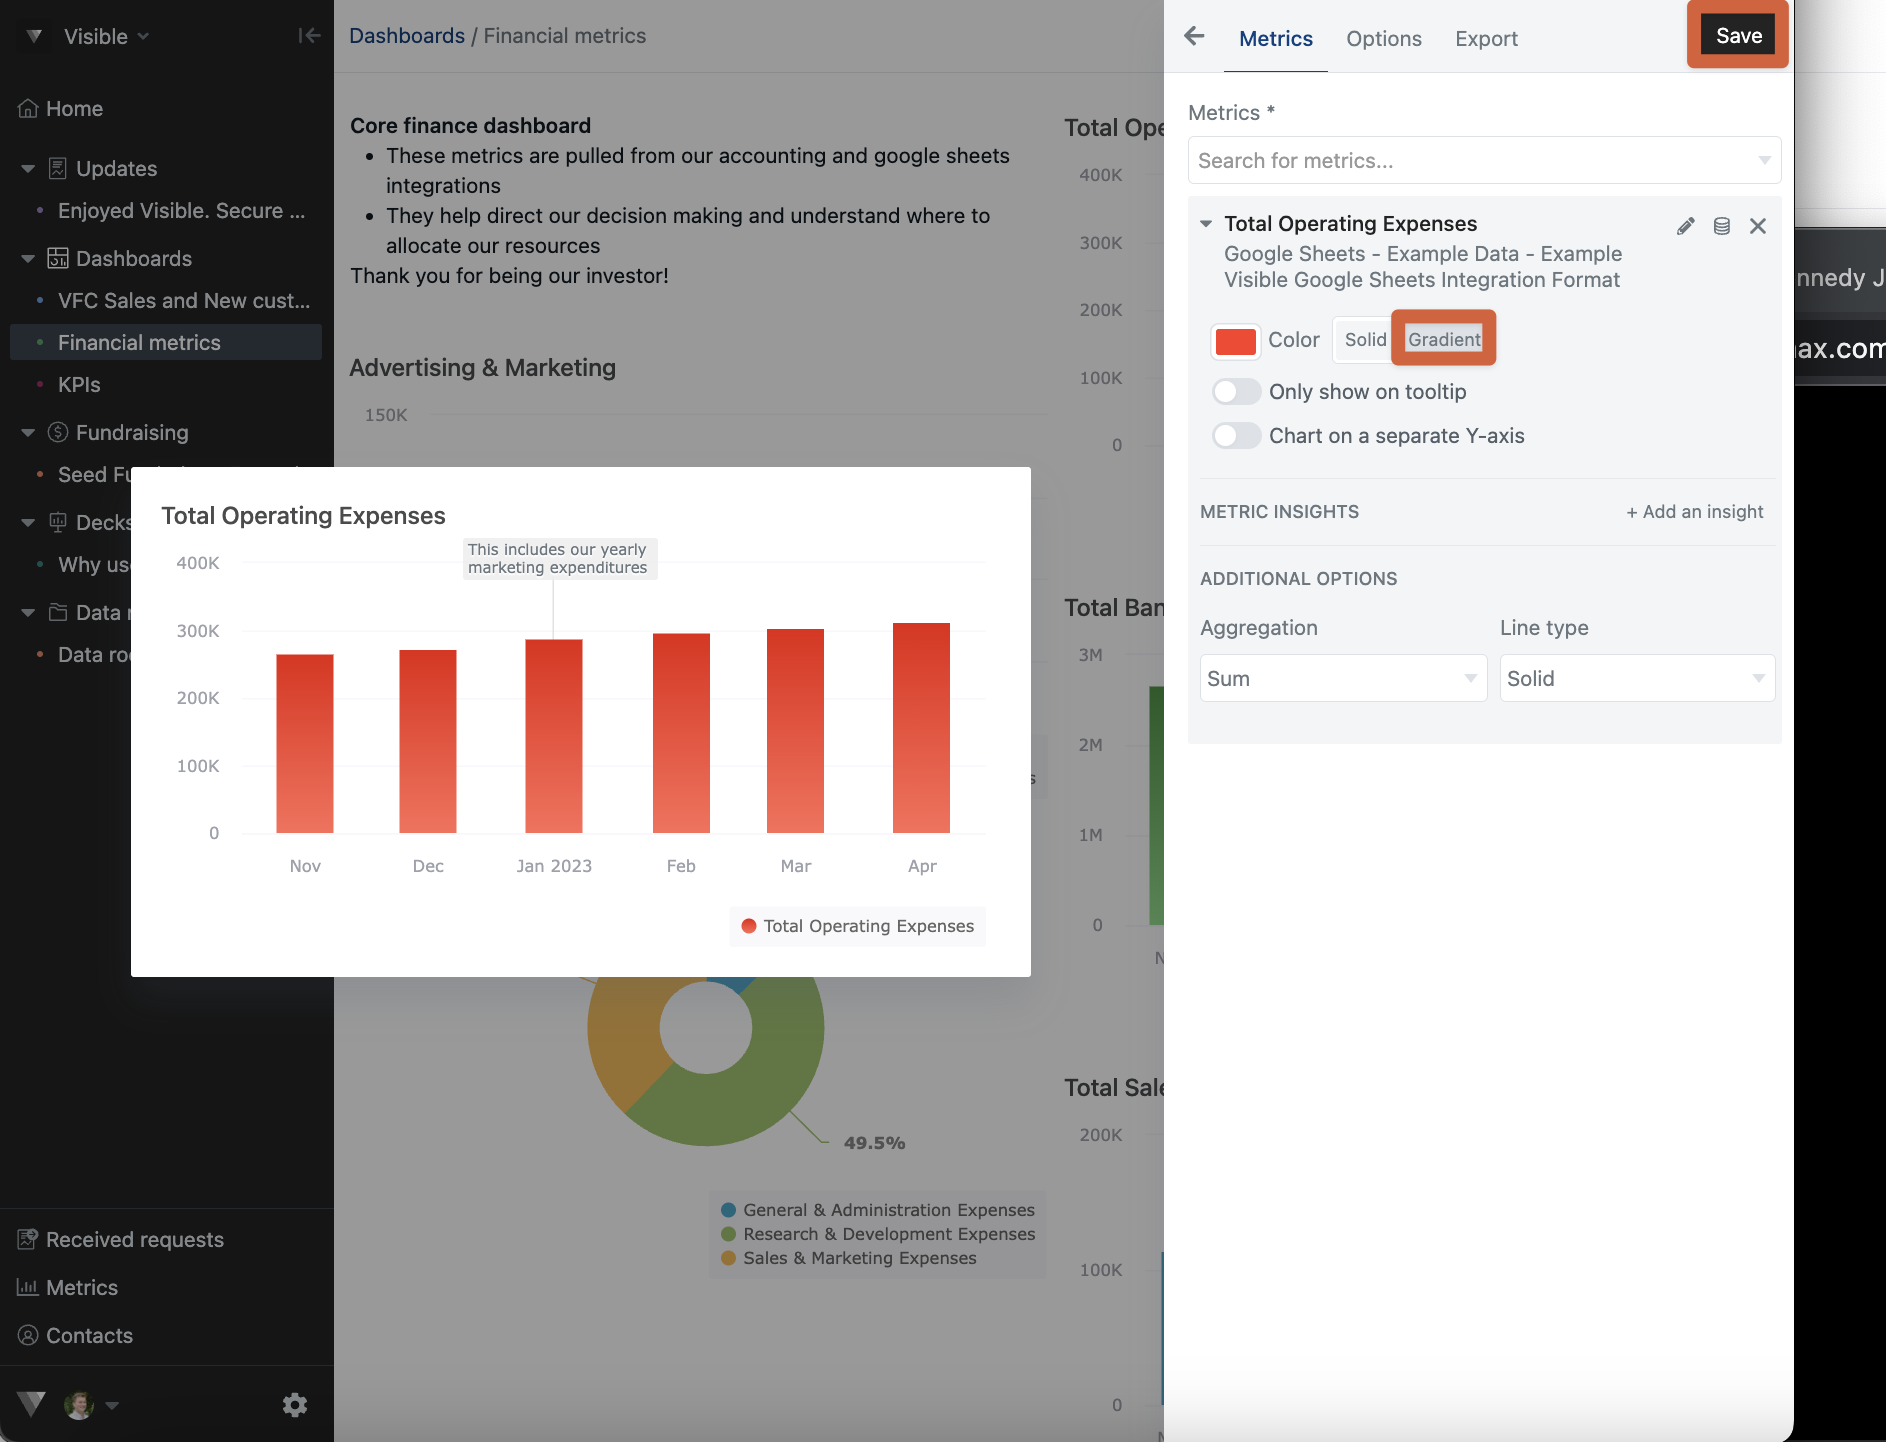
Click on your metric under Metrics
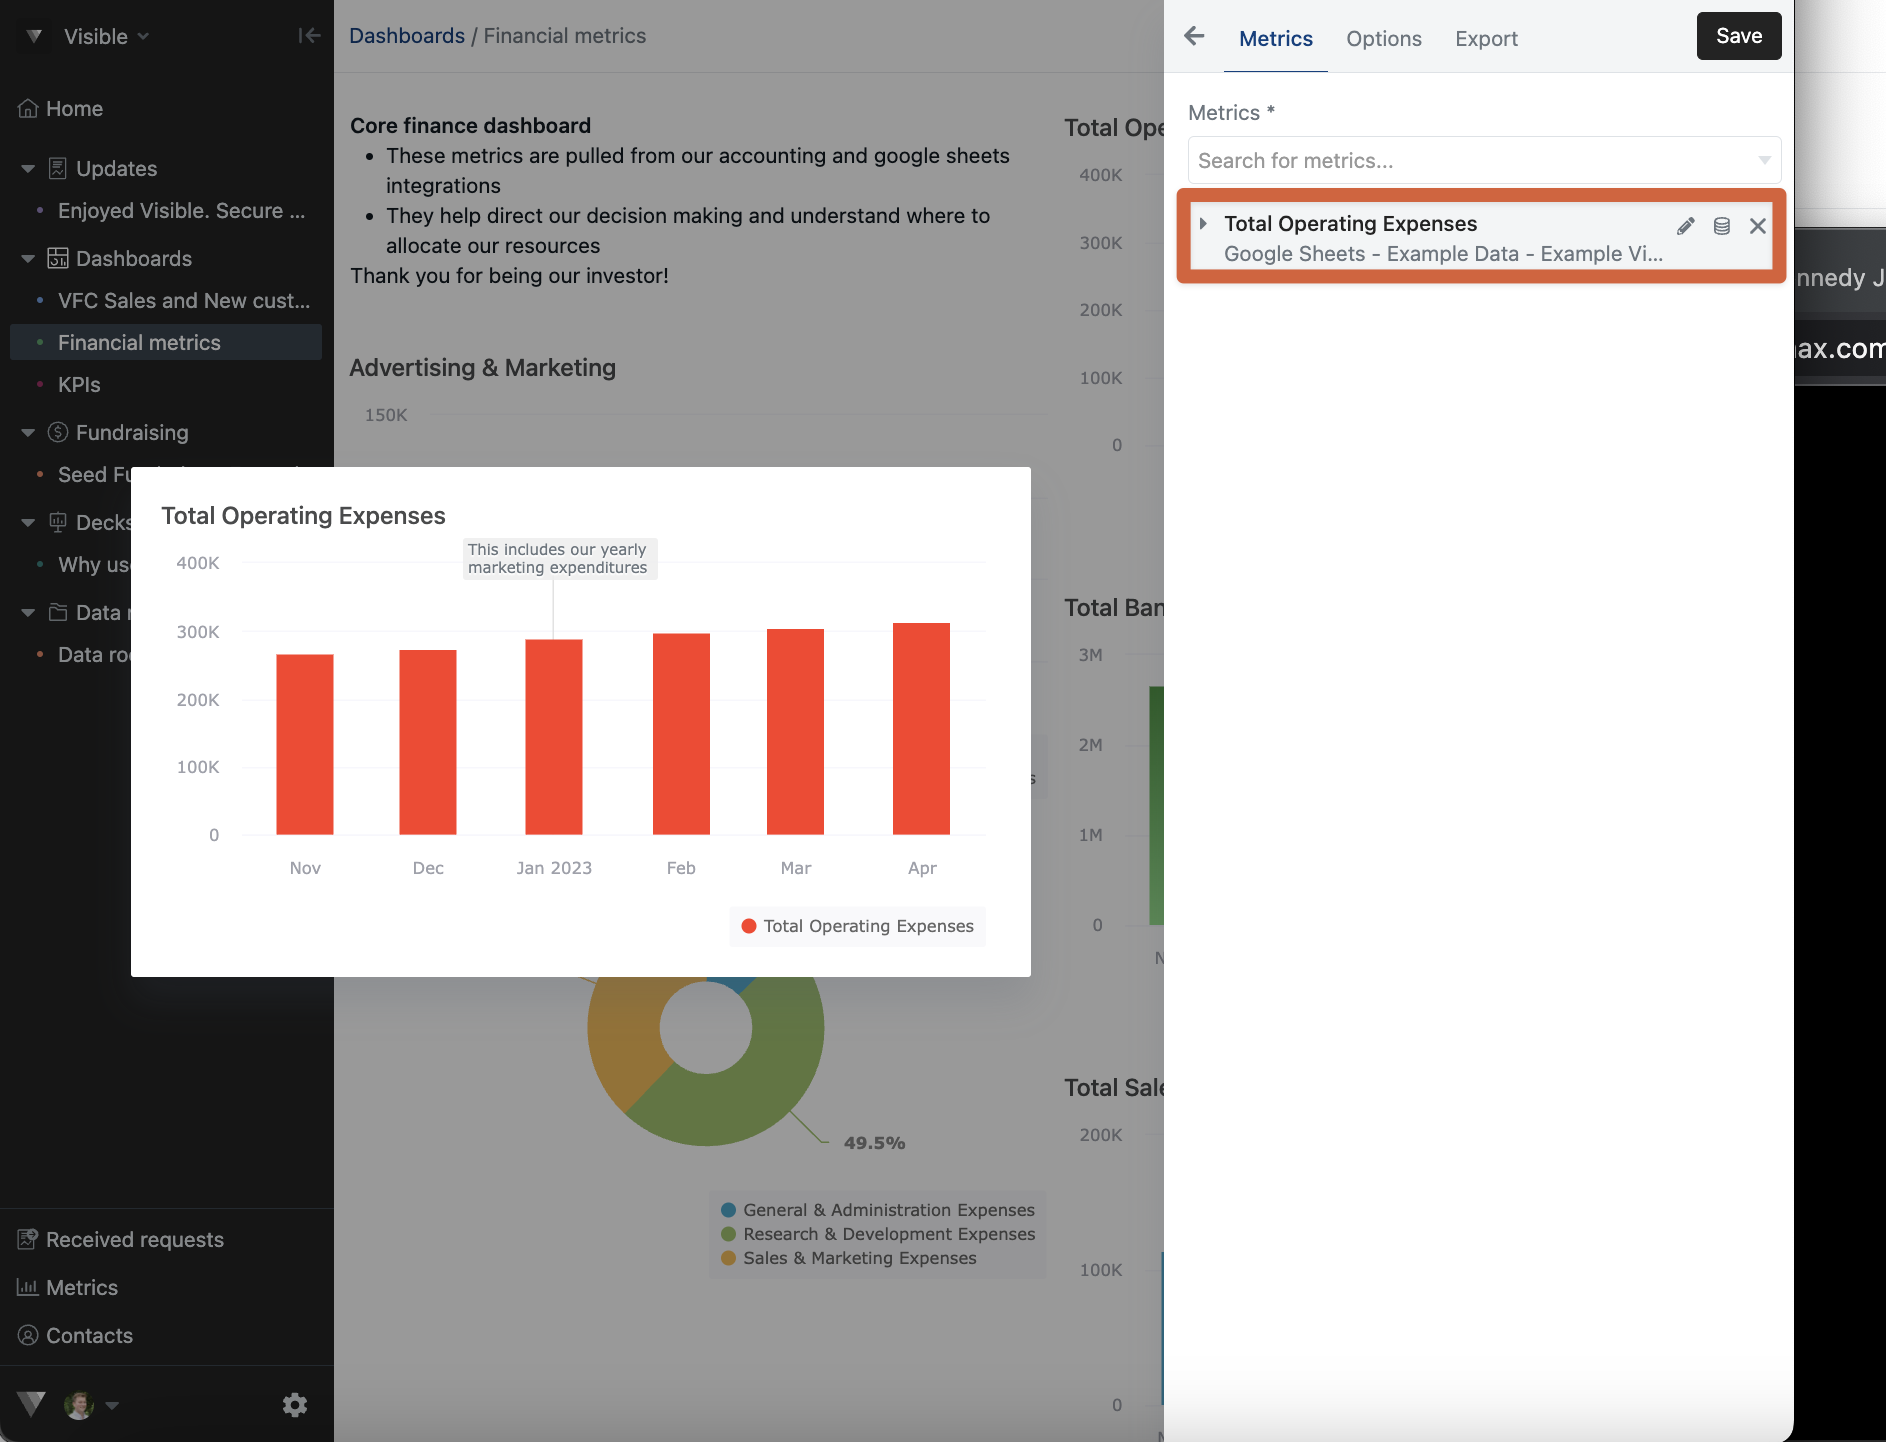
Choose Gradient and click Save in the top right.
Let us know if you have any questions when building our your charts and dashboards.