
Analyzing metric data using dynamic insights
Metric insights provide you with enhanced flexibility when analyzing data in Visible. Insights are accessible in metric formulas, dashboards, and portfolio reports. Keep reading to learn how to utilize insights.
- How to use insights in portfolio reports
- How to use insights in metric formulas
- How to use insights in dashboards
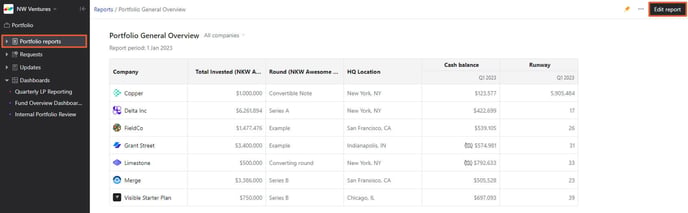
How to use insights in portfolio reports
Navigate to the portfolio report section of your account and open the respective portfolio, then click edit report.
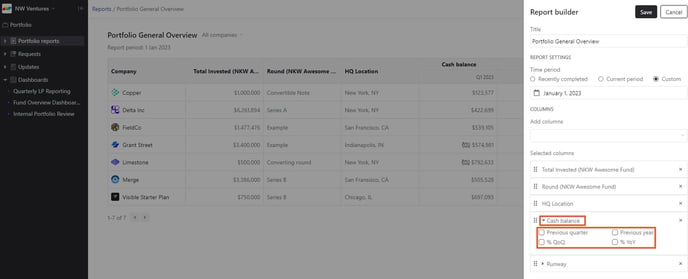
Click on the metric name to expand the list of insights, then click the check box to select an insight. Click save when done.
You'll then see insight populate as a new column. 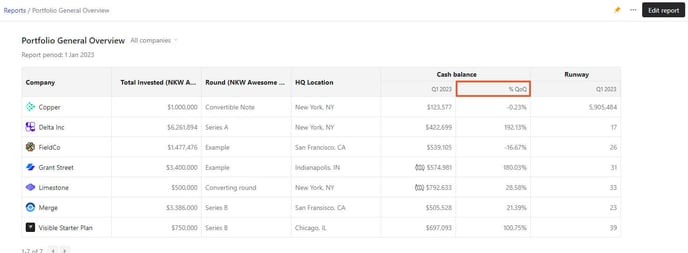
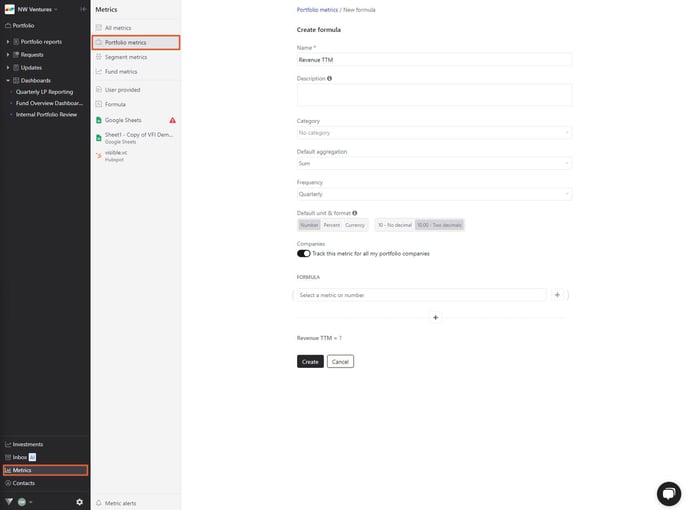
How to use insights in metric formulas
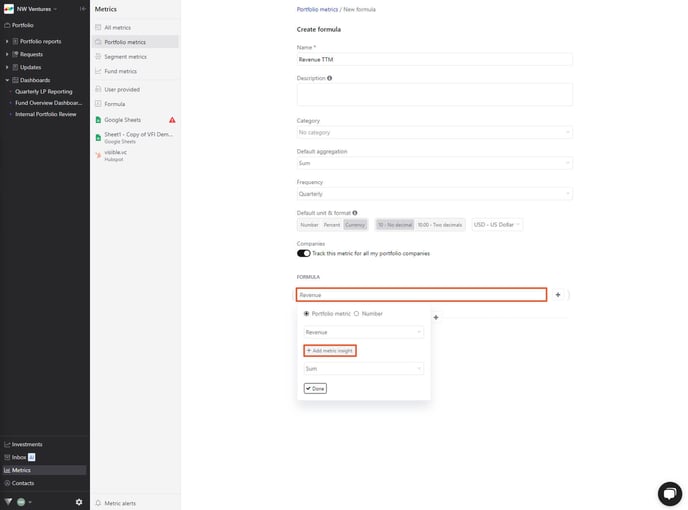
Navigate to the portfolio metrics section of your account and click the respective formula or click +New formula.
Click on an expression in the formula to open the editor, then click +Add metric insight.
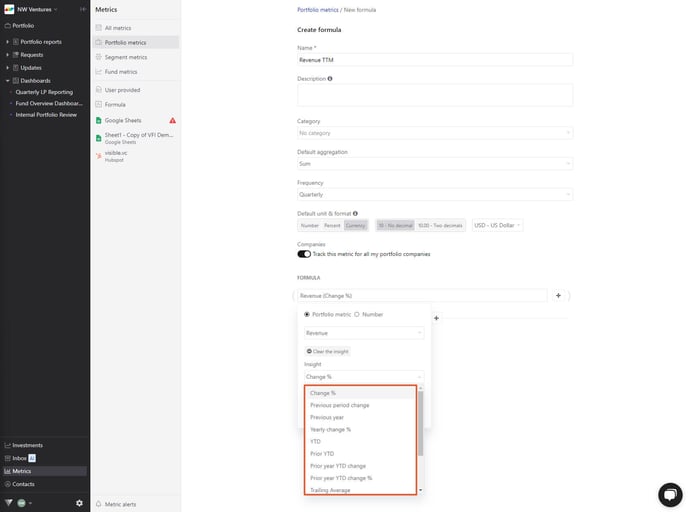
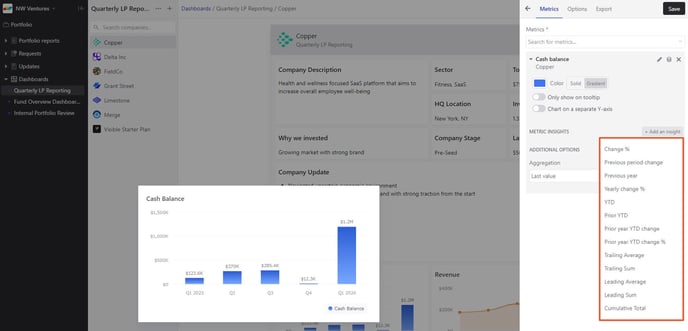
Select from any of the metric insights, including change %, previous period change, previous year, yearly change %, YTD, prior YTD, prior year YTD change, prior year YTD change %, trailing average, trailing sum, leading average, leading sum, or cumulative total.
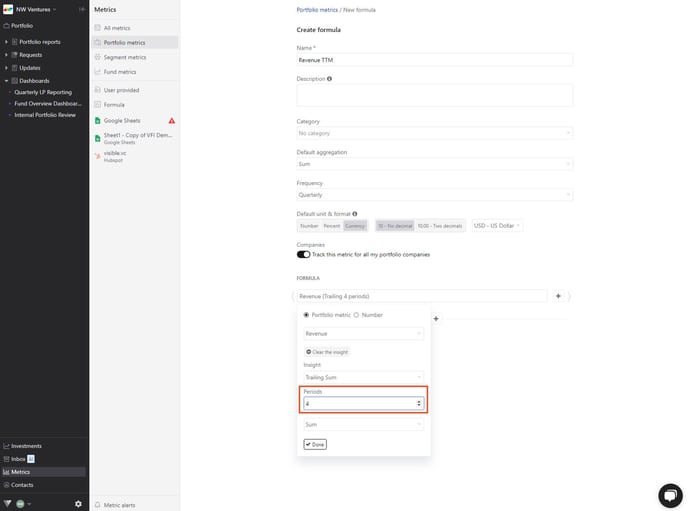
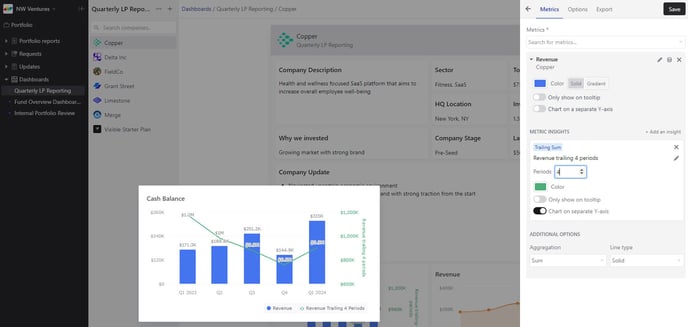
Note, when using trailing average, trailing sum, leading average, leading sum, or cumulative total, you can specify the number of periods. As an example, for data tracked quarterly, you'd pick "trailing sum, 4 periods" to calculate TTM Revenue.
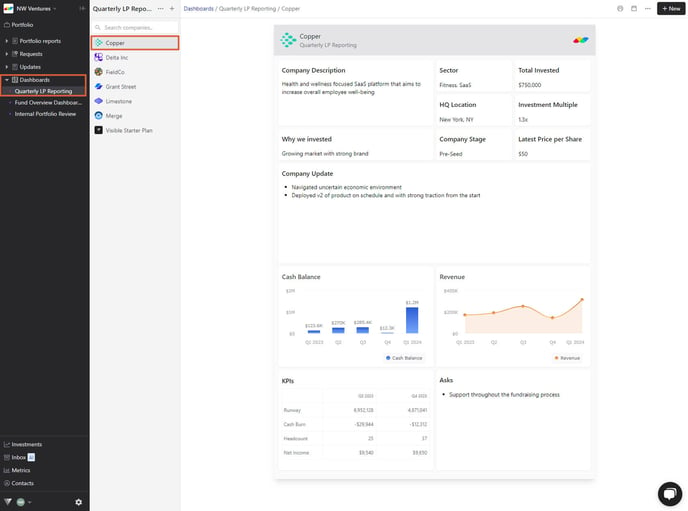
How to use insights in dashboards
Navigate to the respective dashboard, then click the respective chart or table.
Click the metric name followed by +add an insight.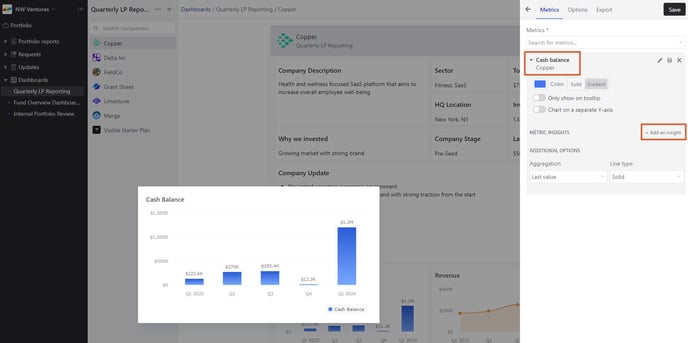
Choose from the list of insights, then click save when done.
 Note, when using trailing average, trailing sum, leading average, leading sum, or cumulative total, you can specify the number of periods. As an example, for data tracked quarterly, you'd pick "trailing sum, 4 periods" to calculate TTM Revenue.
Please let us know if you have any questions!