
A quick tutorial on how to stack area charts
To stack an area chart simple create a new chart or edit an existing one. See below how you can edit an existing chart

Make sure you have 2 or more metrics being plotted similar to the example below. From there you'll want to navigate to the Options tab in the top right of your chart builder.
From there select your chart type and what type of stack type you would like to use. For our example, we will be using a normal stack type. Save when done.
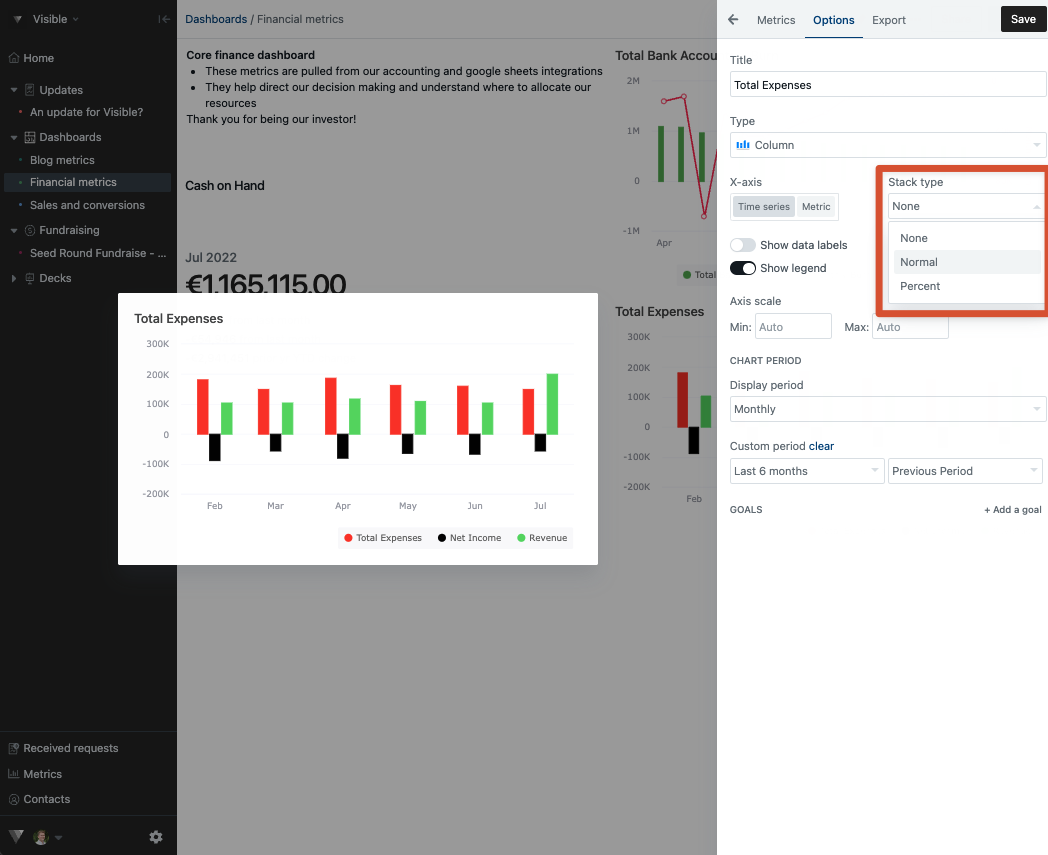 Note: you could also stack the chart by percent instead of actuals as well.
This will create a stacked chart for you
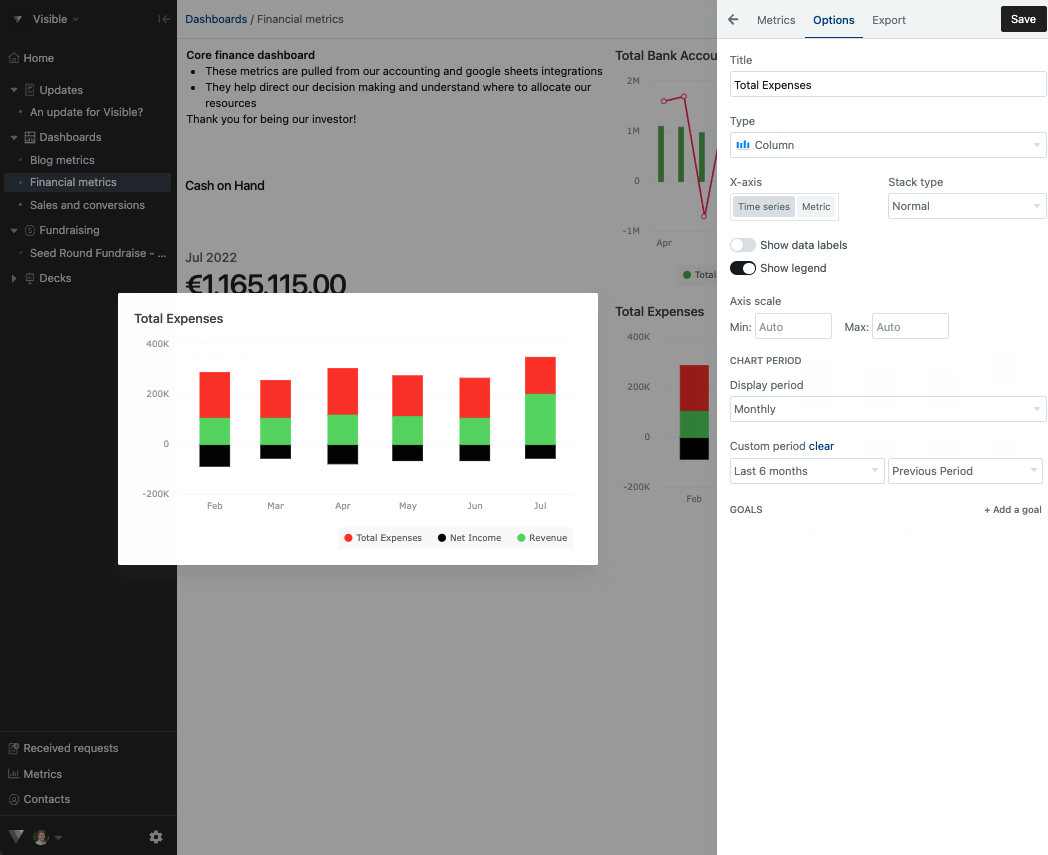
Click save and you'll be on your way! Please us know if you have any questions!