
How to use the number widget and other tips/tricks
Creating a Number Widget
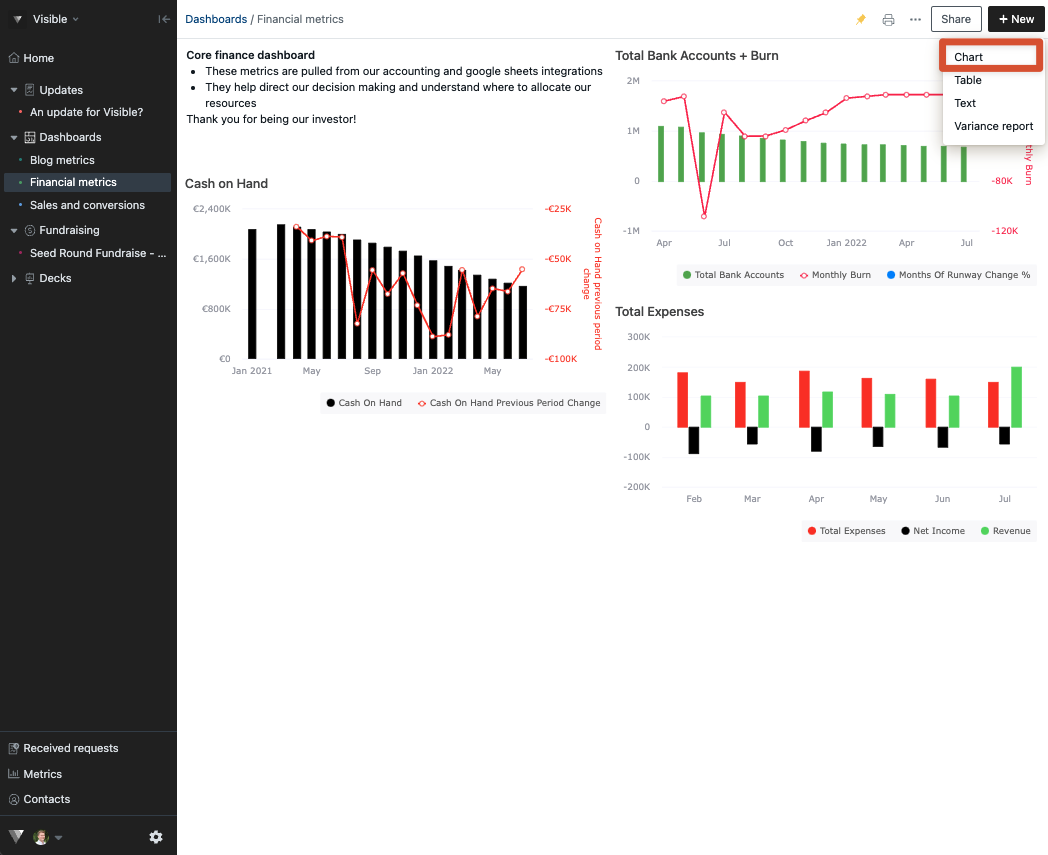
To use the number chart, you will want to open Visible and click on Dashboards along the left side of your screen. Open the dashboard where you want the chart to live and click + New --> Chart in the top right of your dashboard.
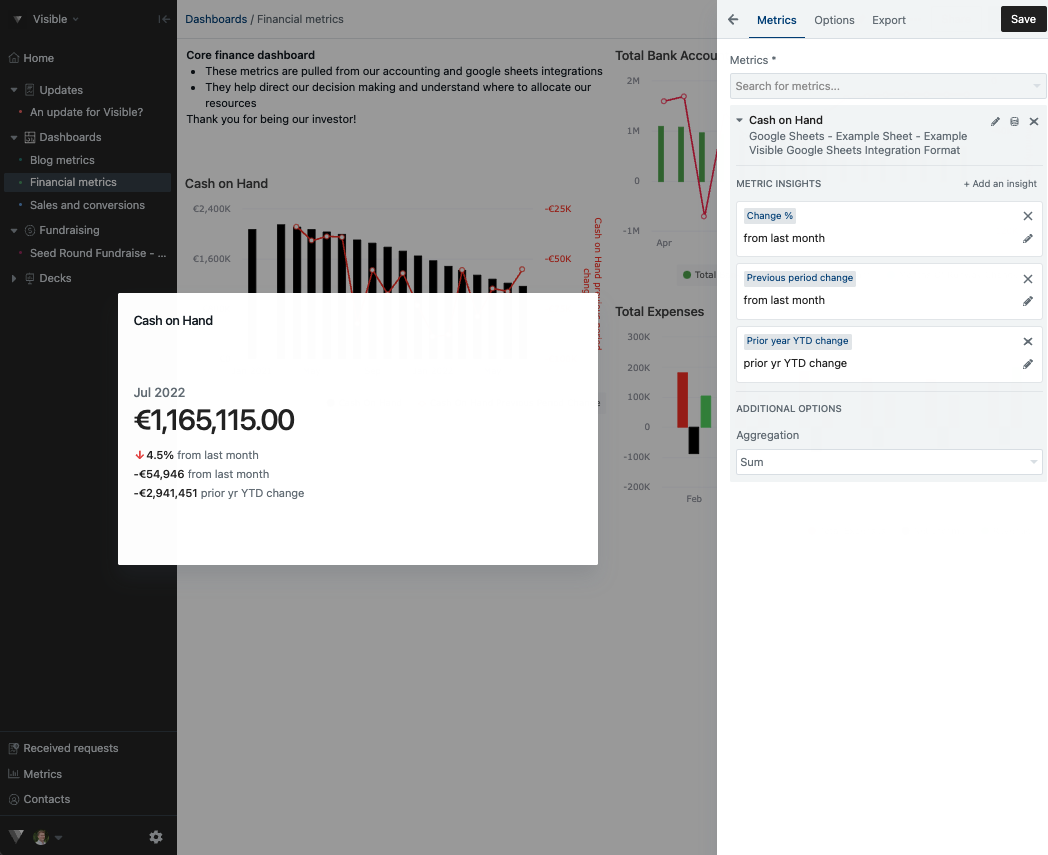
Enter the metrics you wish to represent in the number chart and set the chart type to be Number. Adding metric insight will enable you to show growth, decline, and change of this metric over a certain time horizon. See screenshots below on how to construct a number chart in Visible!
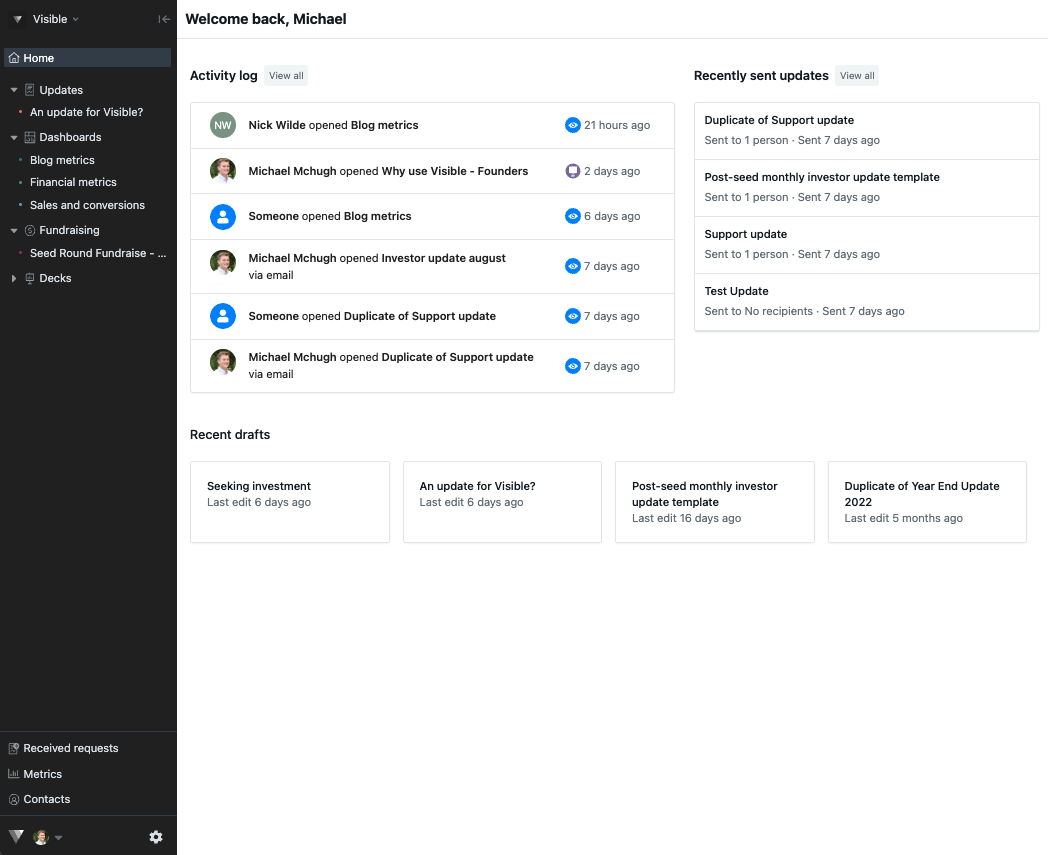
Open Visible
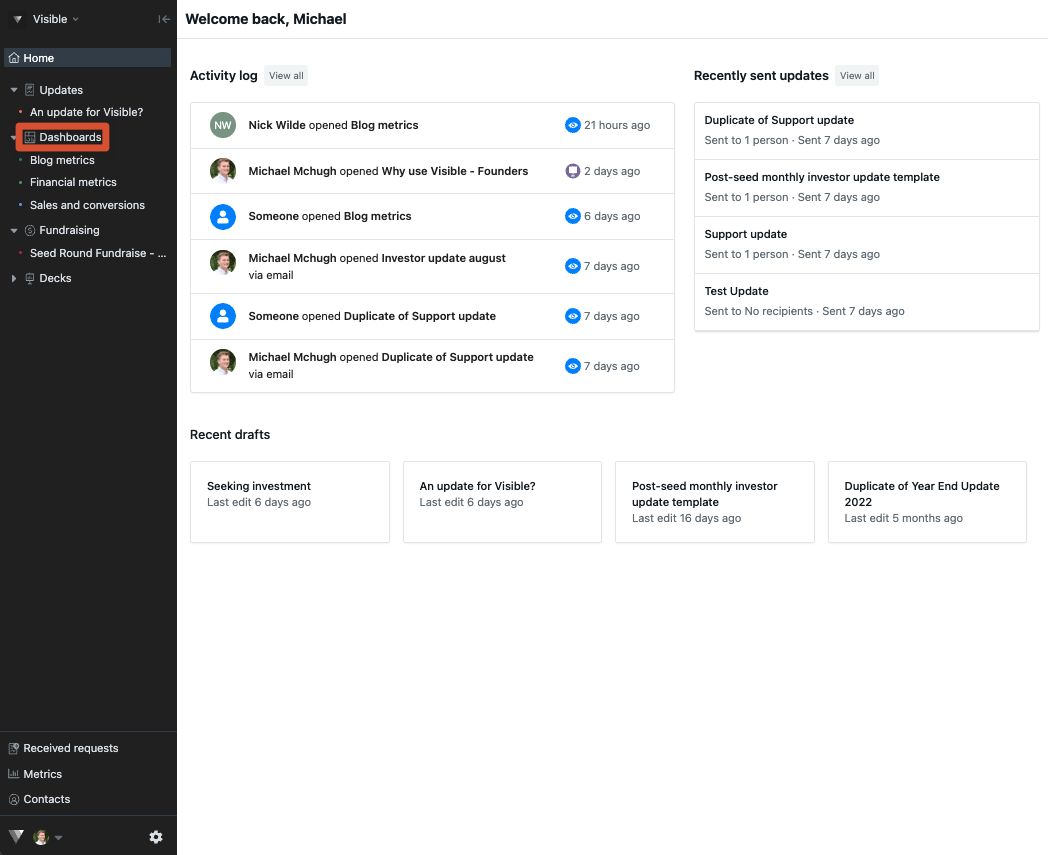
Click on Dashboards along the left side of your screen
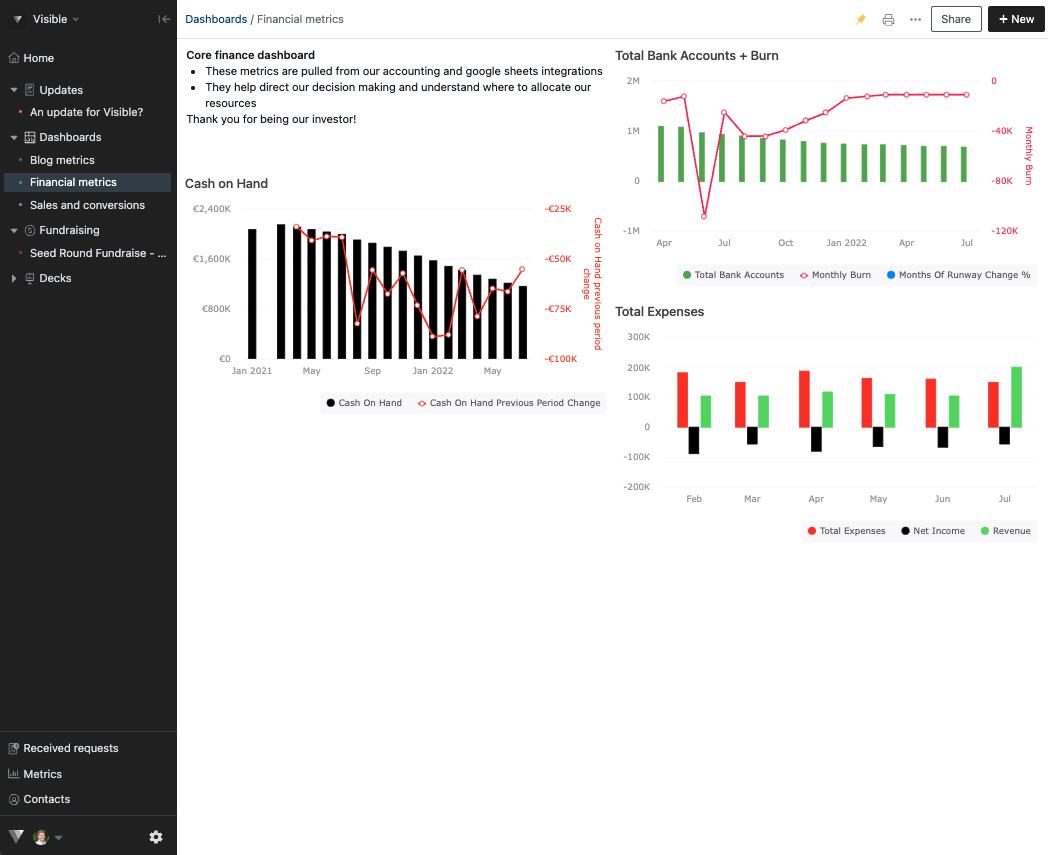
Open the dashboard where you'd like the number chart to live
Click on + New in the top right corner of the dashboard
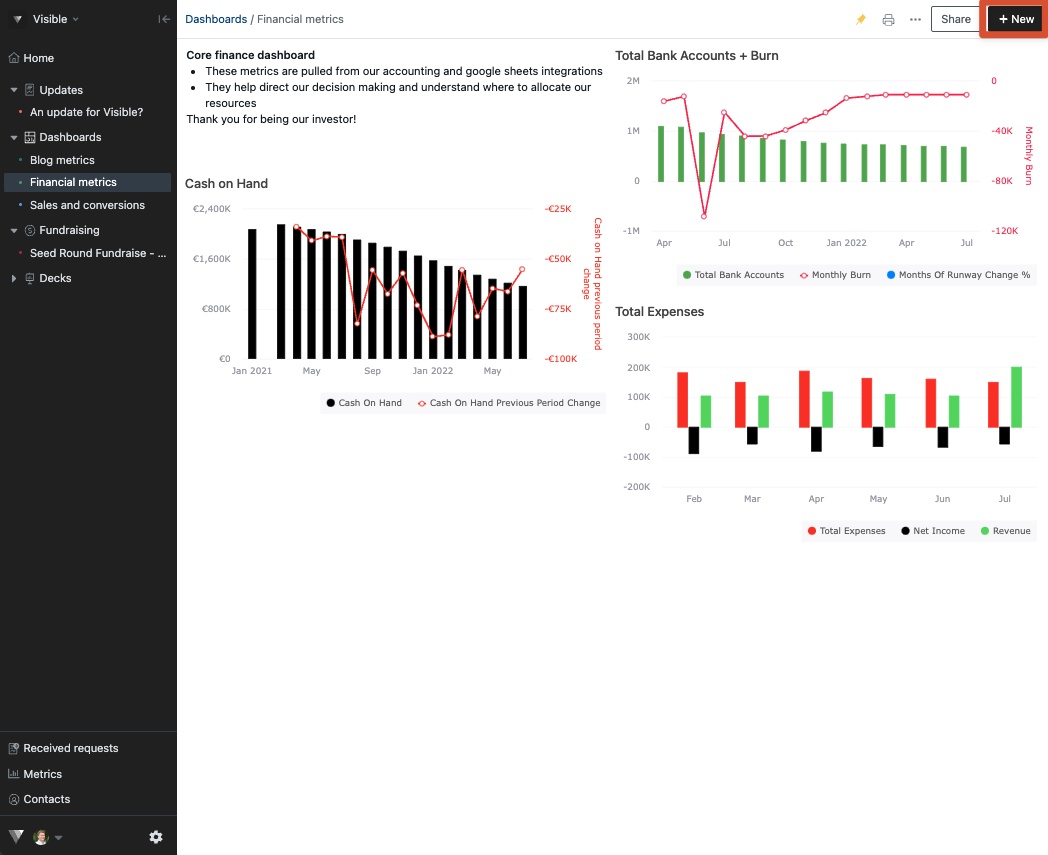
Click Chart
This will open the chart builder for you
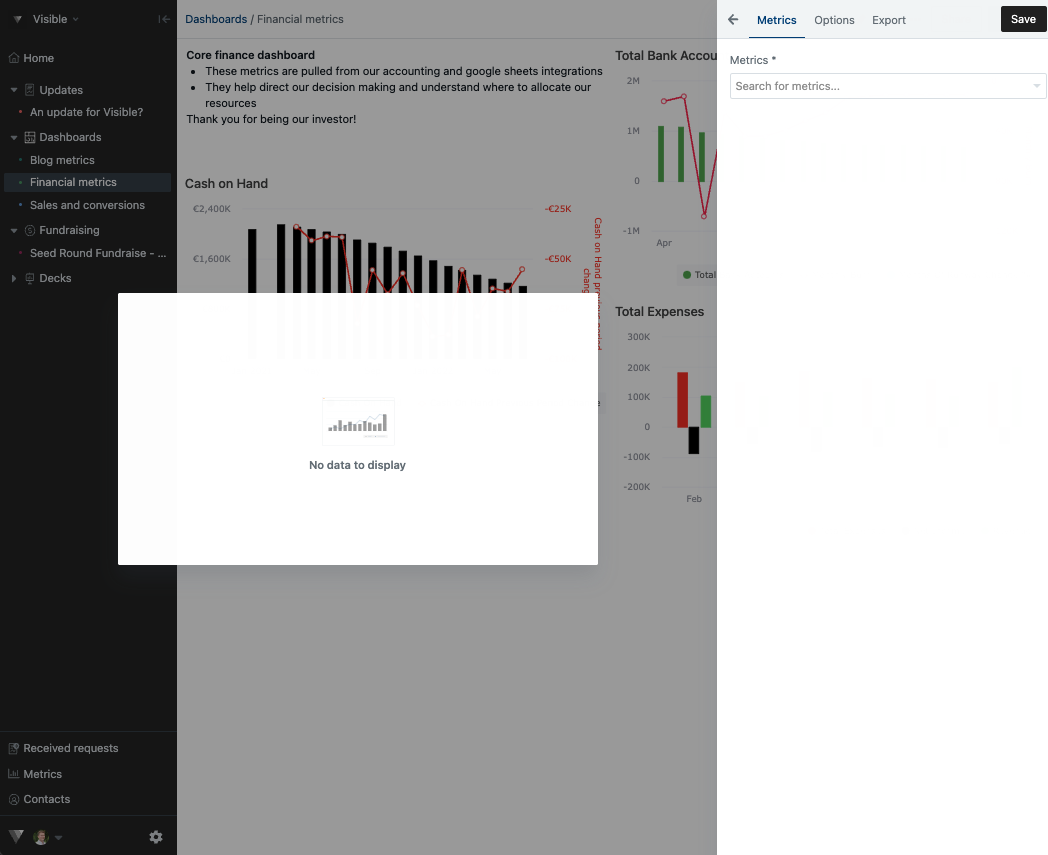
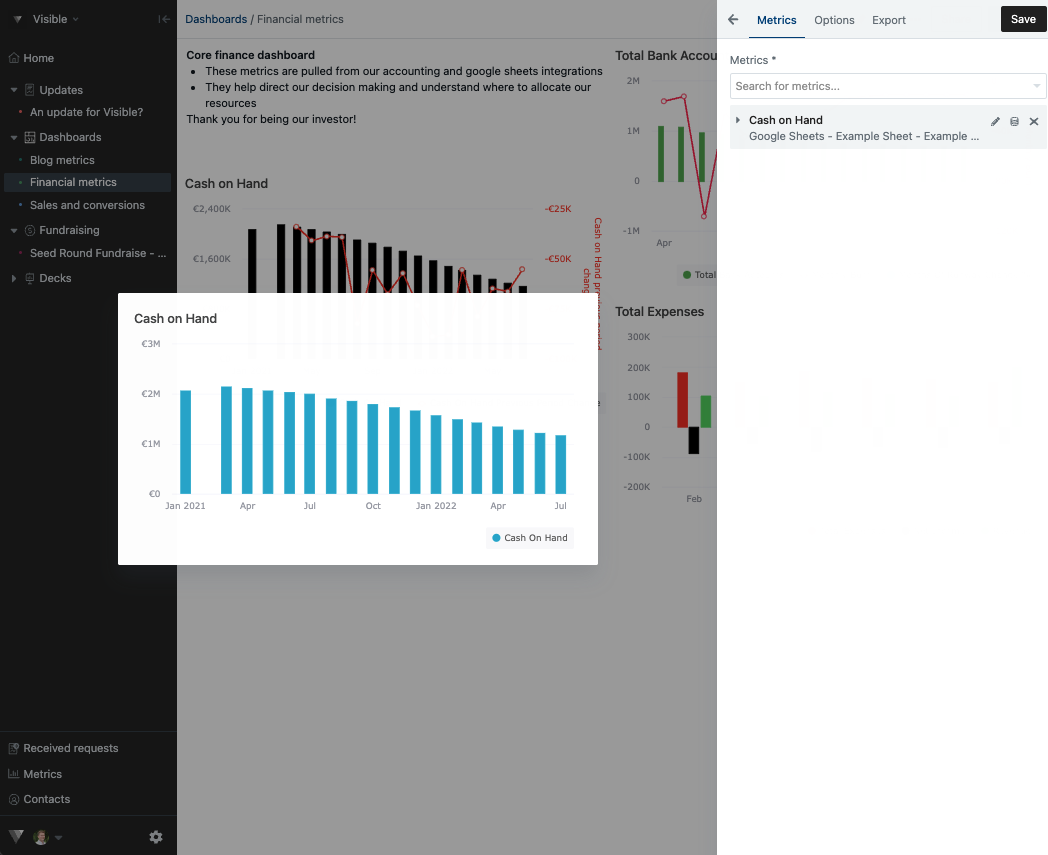
Add in the metric you wish to represent in the number widget
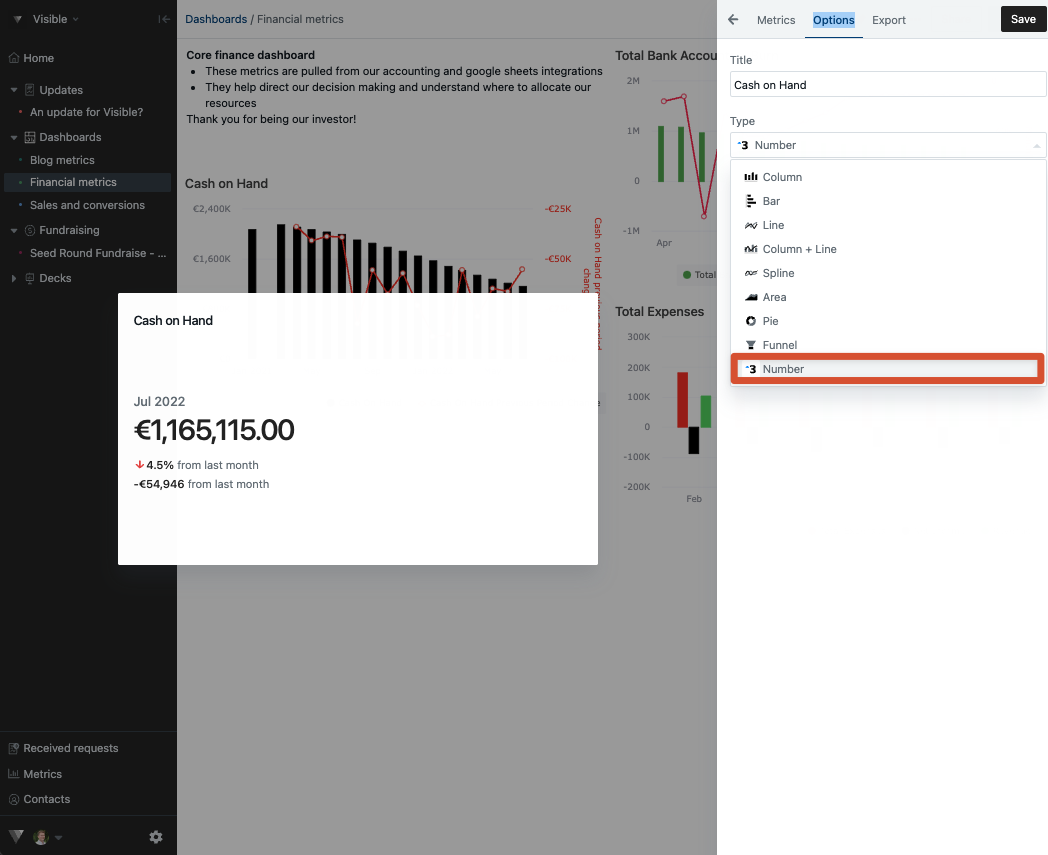
Click Options along the top of the chart builder
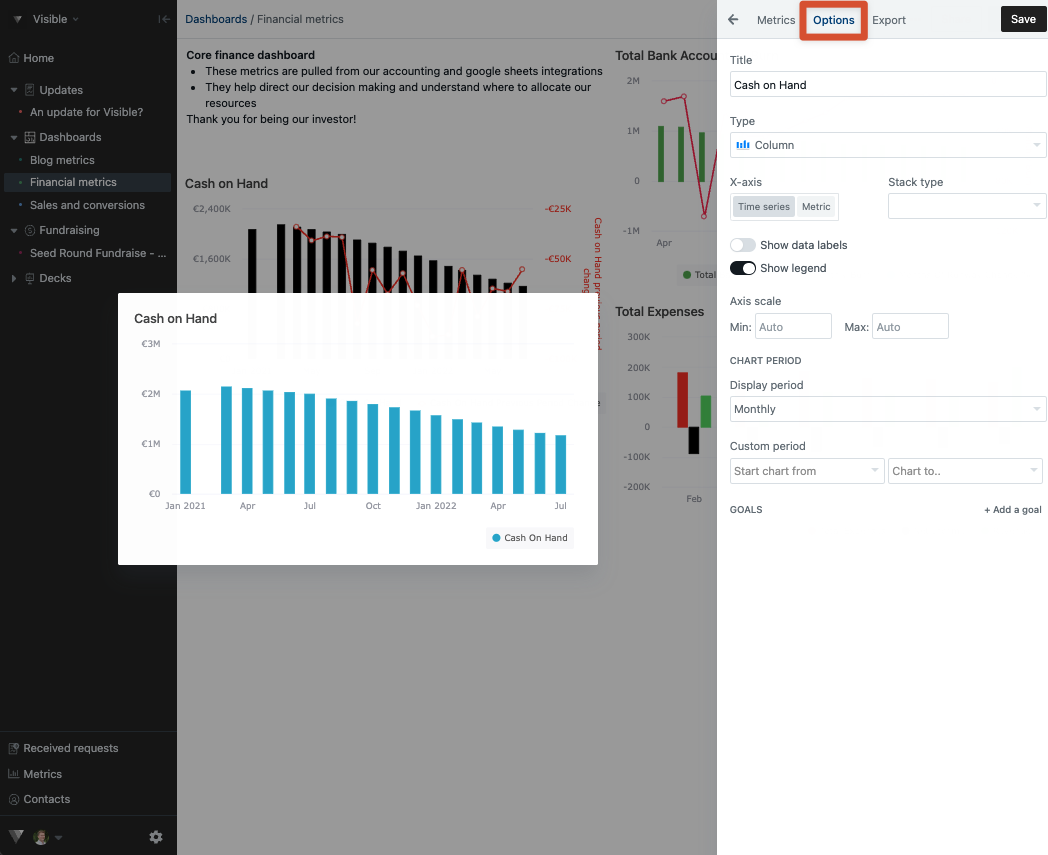
Switch the chart type to Number
Add metric insights to make the widget more descriptive.
We hope this helps. Please let us know if you have any additional questions!