
The different types of IRR supported by Visible and how to visualize them in a dashboard.
Visible auto-calculates the following IRR metrics:
- Gross IRR
- Net IRR
- IRR (for individual investments)
For more information on how IRR is calculated in Visible check out -- Auto-calculated fund and company investment metric definitions.
Visualizing IRR in a Dashboard
You can access the auto-calculated IRR metrics in both Flexible Dashboards and Portfolio Metric Dashboards.
To get started with adding IRR to a flexible dashboard, make sure the related Fund Metrics are up to date in your account. Then, navigate to the Dashboards section in the left side pane of your account. From there, either open an existing dashboard or create a new dashboard.
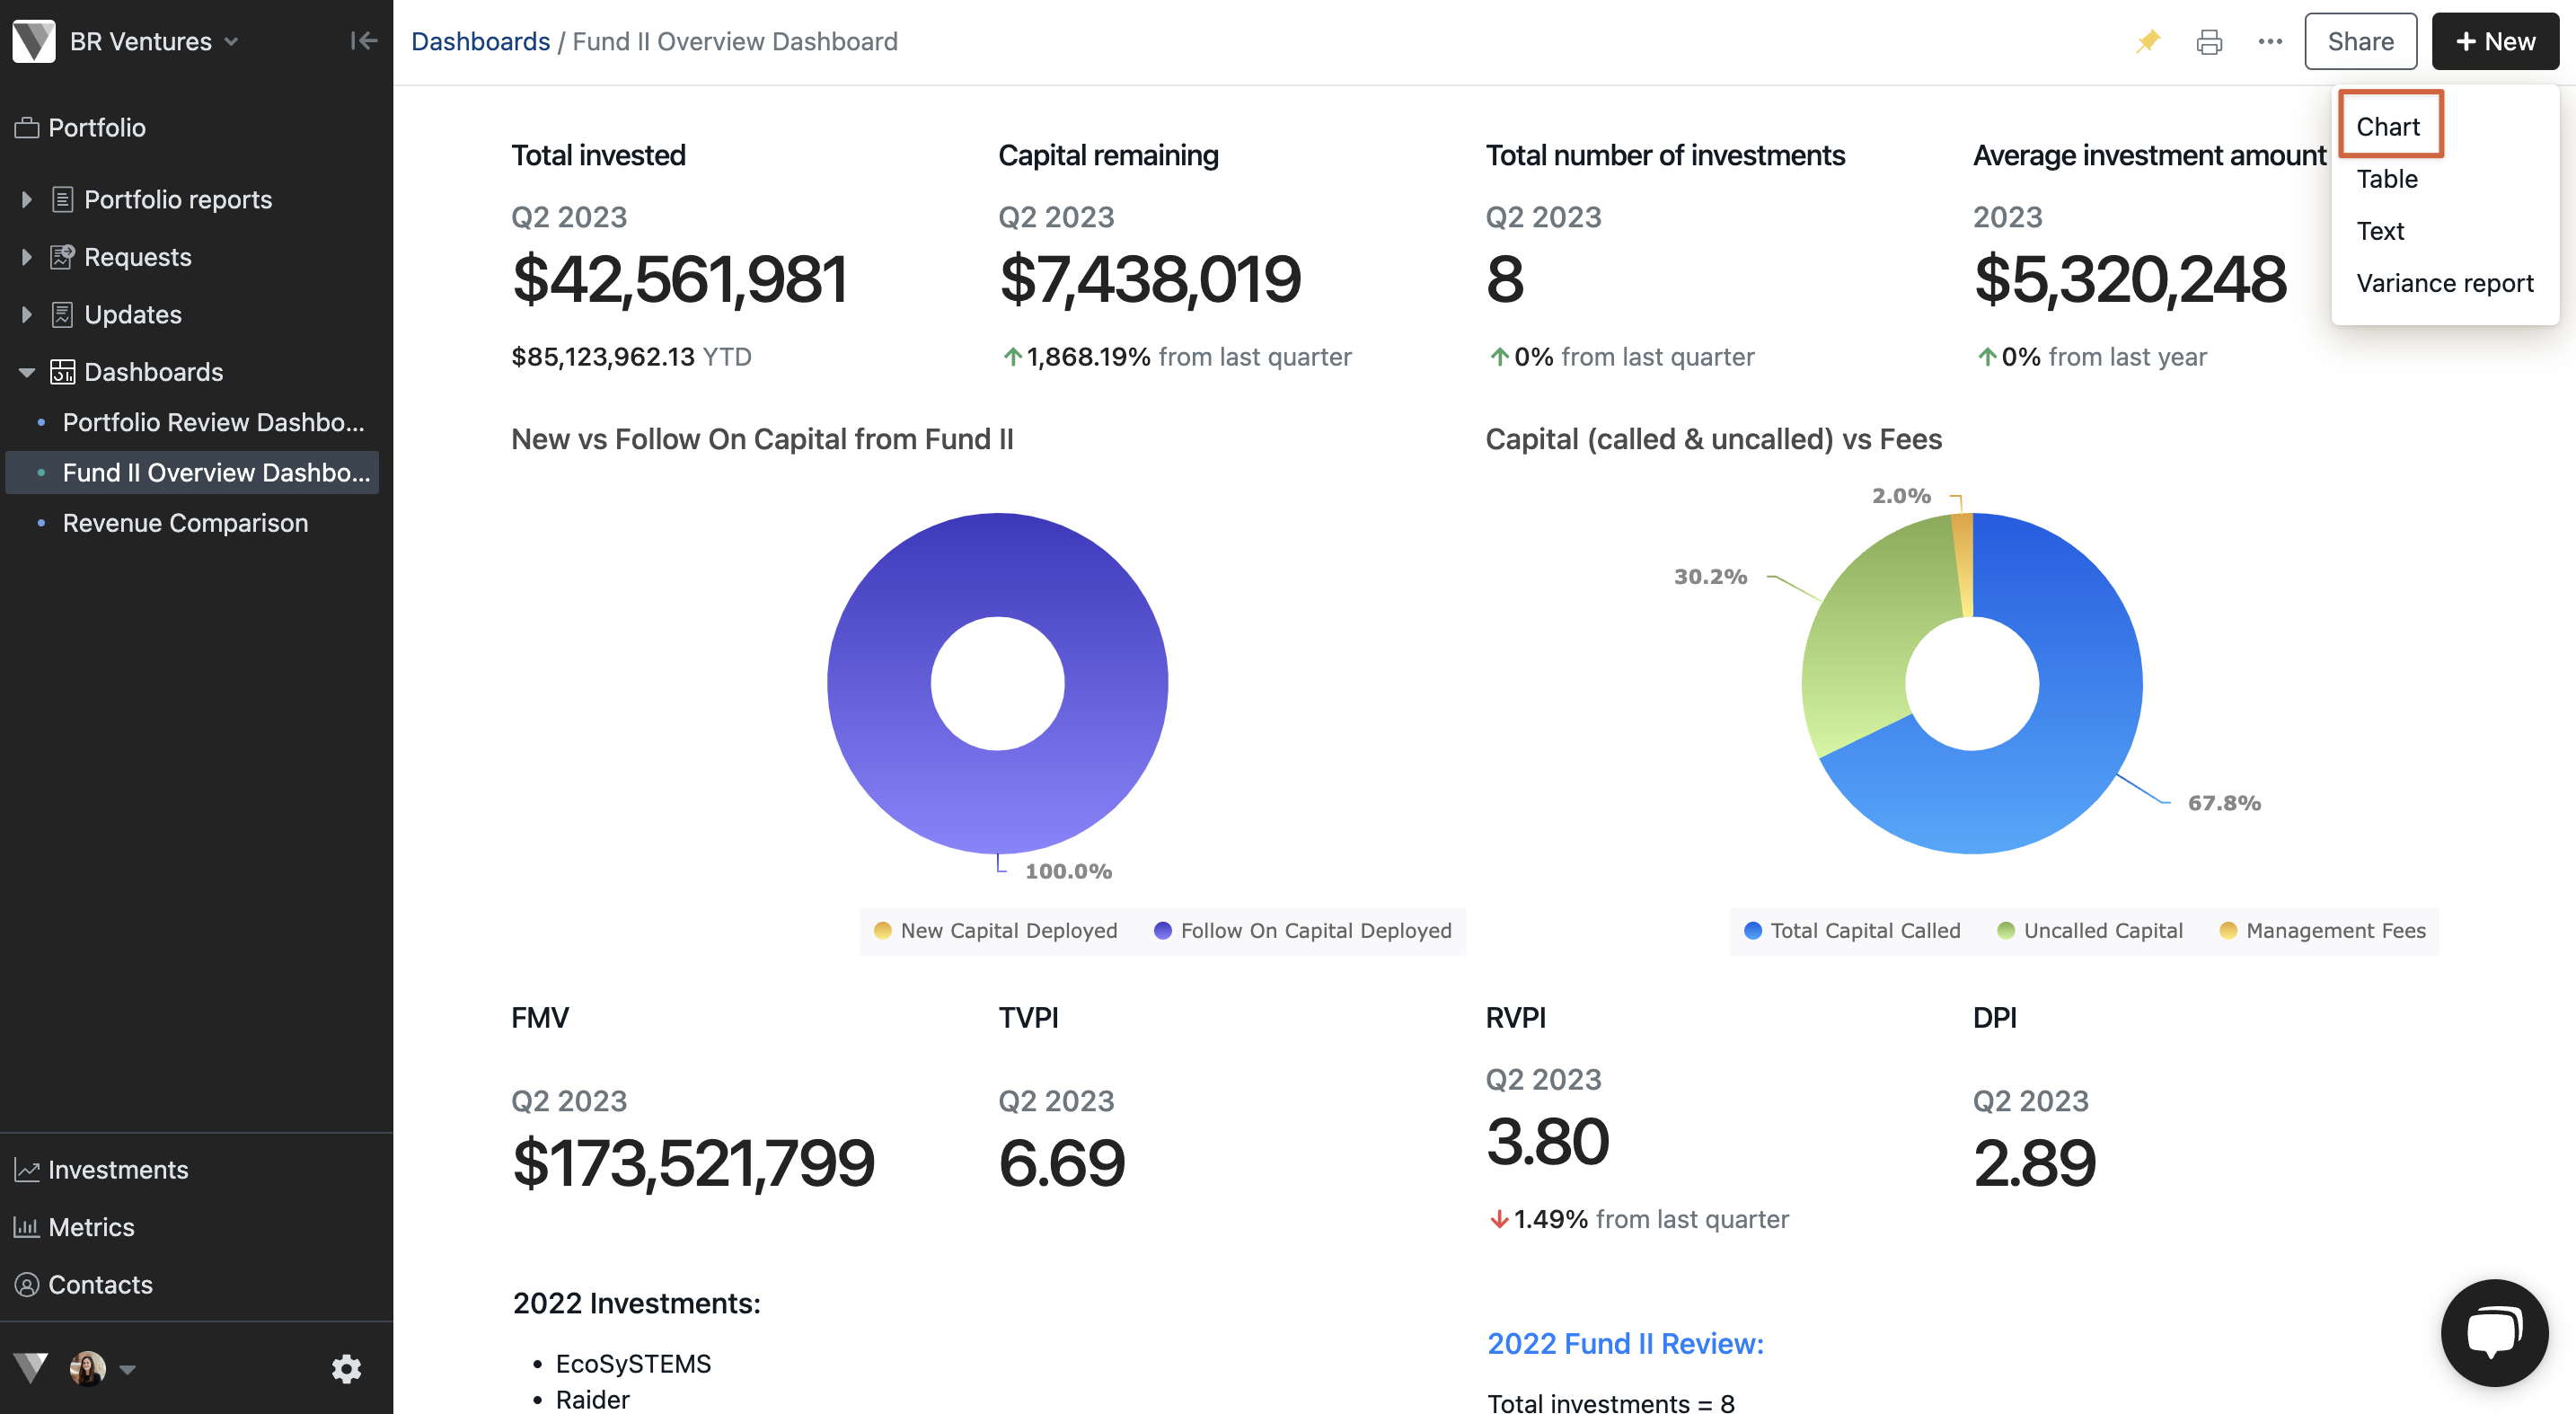
Then, select +New at the top right and select Chart.
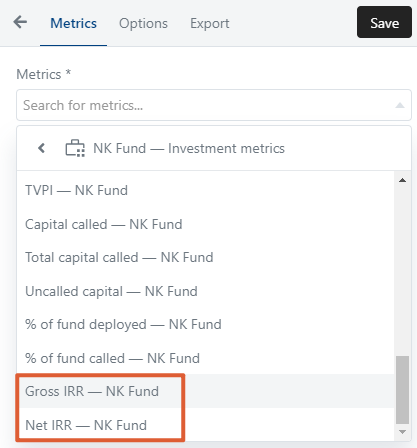
The fund IRR metrics can be found within the metric dropdown options under a specific fund.
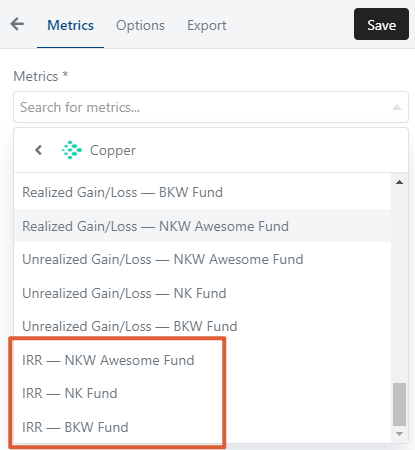
Individual company IRR's metrics can be found within the list of metrics listed on a specific company.
Next, select the IRR metric you want to visualize and then choose the chart type for how you want to display your data.
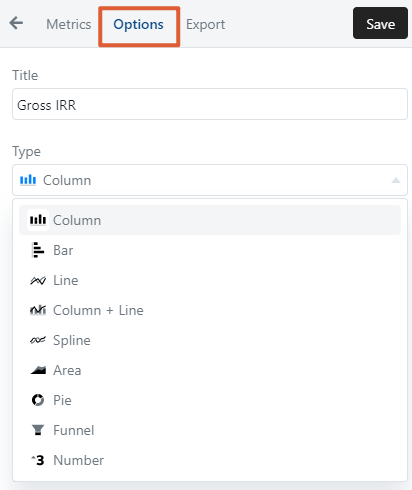
When you're done select Save and the new chart widget will be added to your dashboard.