Analyzing and visualizing your fund performance metrics
Note: To create a fund analytics dashboard, you will need to create funds and add investment data to your account.
Creating an investment dashboard from the template
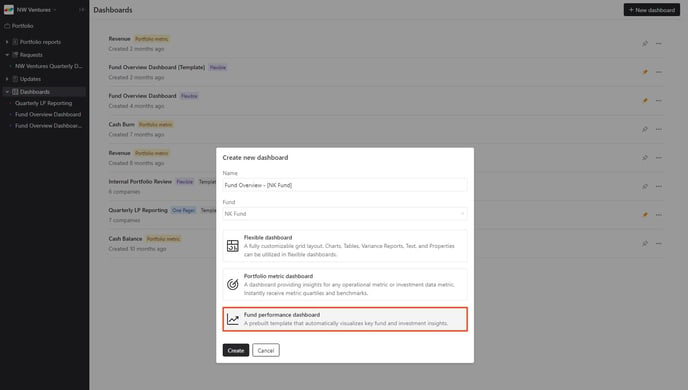
To visualize your fund data within Visible, navigate to the Dashboards section on the left side pane. From here, select + New dashboard at the top right. Then choose Investment dashboard. You will be prompted to select which fund you want to visualize data for.
Then select Create in the bottom left.
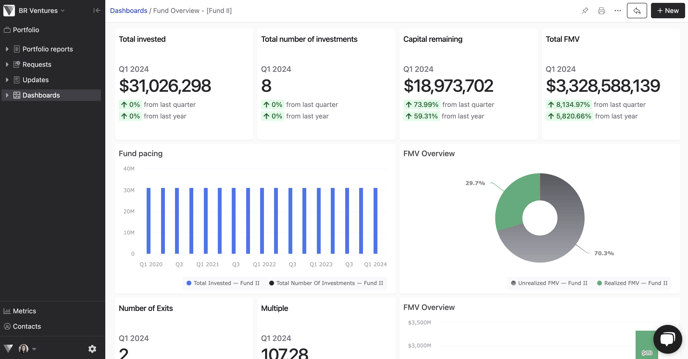
A best practice dashboard will automatically be created for you within seconds.
Note: If you are missing any data you will need to enter the related round details or fund metrics.
Customizing the widgets on the dashboard
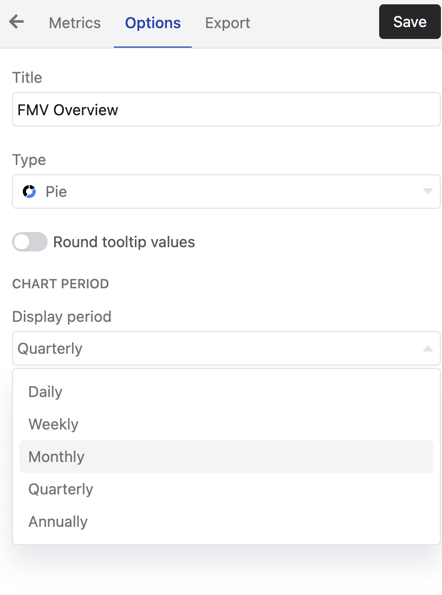
To customize details like the title, data sources, chart type, reporting period, and color hover over the top right of a widget and then select edit.
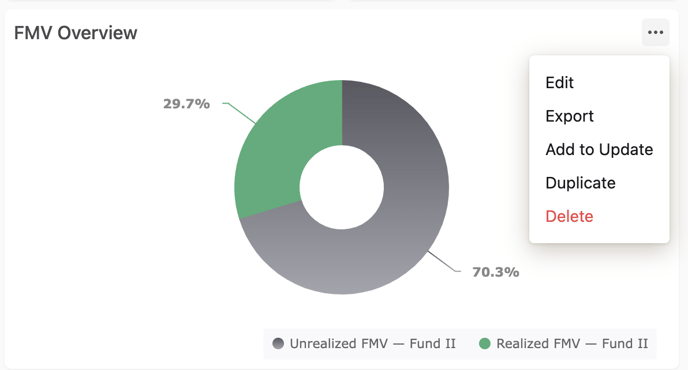
From the Metrics and Options will be able to edit everything about the widget.
 Adding more widgets to the dashboard
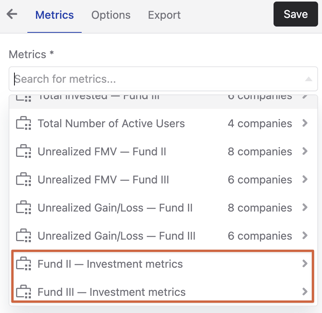
To add a new widget to your dashboard, select +New at the top right of your dashboard and choose which type of data you want to add to your dashboard.
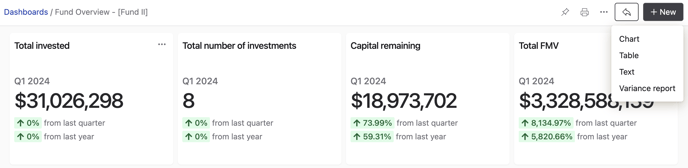
Investment data can be found by scrolling to the bottom of the list. If you don't see an option you first need to set up your fund within Visible.