
Aggregating your portfolio information and data in a table
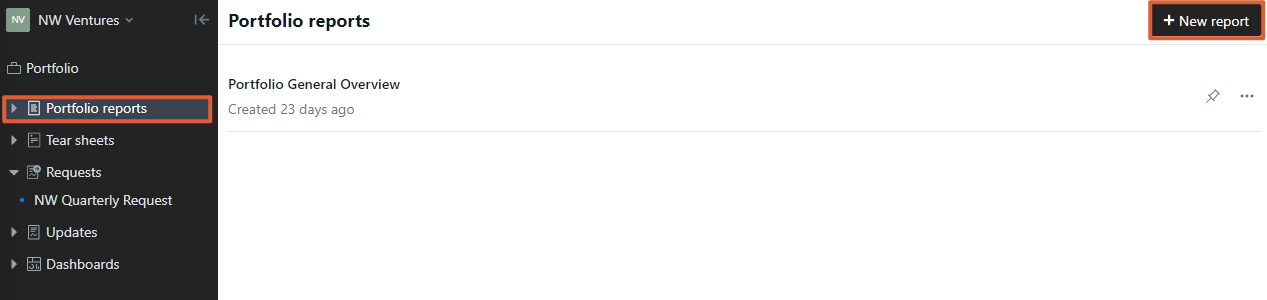
Portfolio reports make it easy to visualize your portfolio data in a table. To start, navigate to the Portfolio reports section on the left side of your screen. Click +New report to begin creating a new report.
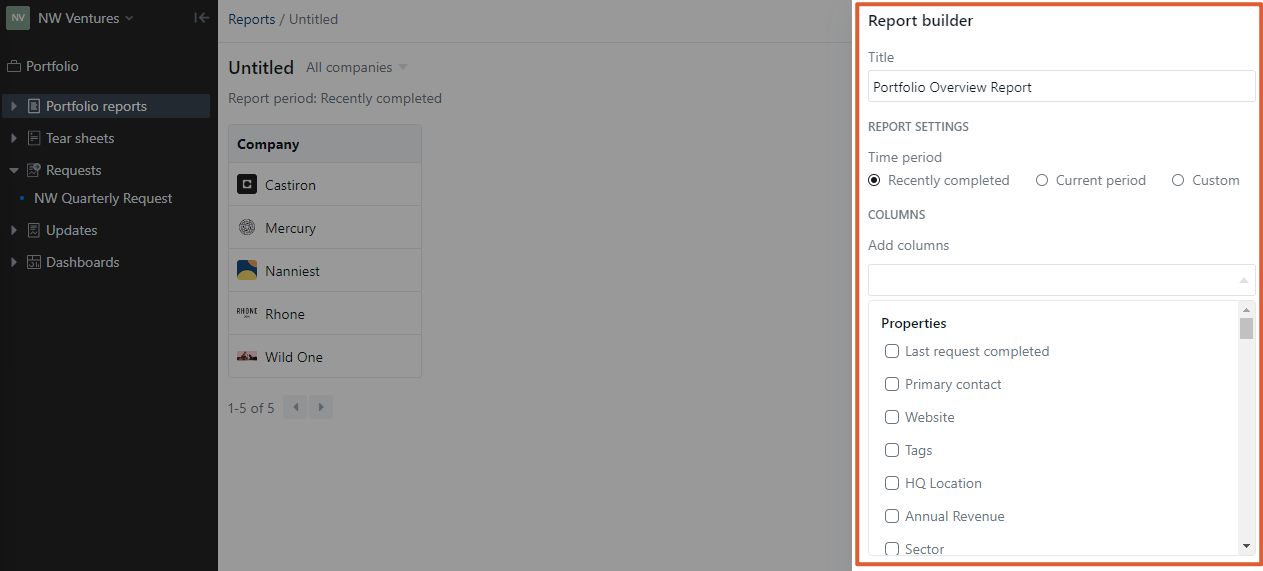
Clicking +New report will open the Report builder. Within the Report builder, you can name your report and change the time period. Additionally, you are able to bring in the following types of content underneath the Add columns section:
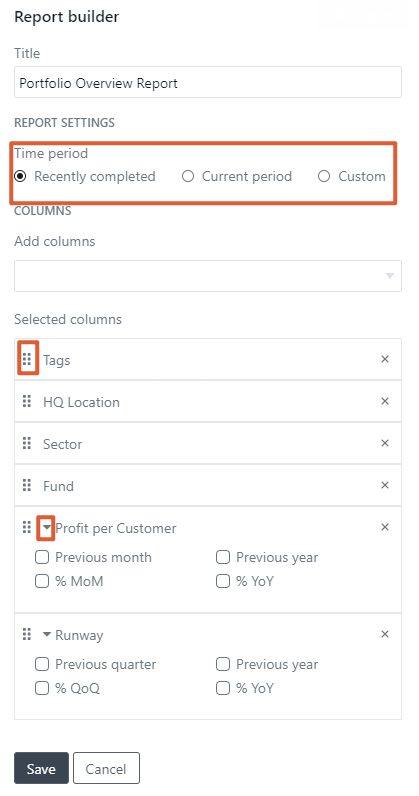
Click and hold the dots next to a column within the Report builder to rearrange the columns. For any metric or investment data, click the drop-down arrow next to the name to add insights to any data in your table. Once you've finished building and editing your Report, press Save.
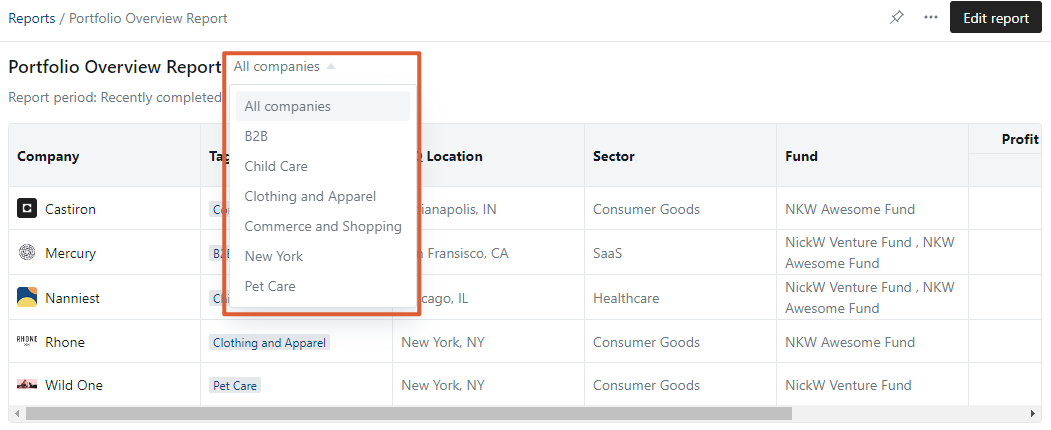
If you have previously set-up segments, you can filter by them in the Report view.
Check out How to export a Report for more information on how to export your Reports.
Please let us know if you have additional questions!