
This article should help you to create a table to be included on your dashboard or include in an update.
To create a Table, you will want to open your dashboard where you want your table to live. Click on the + New in the top right of your dashboard and choose Table. This will open your table builder.
Write in the Title for your Table and choose your metrics. Your metrics you can pull be will User provided metrics or any of your active integrations. You will want to choose your display period (Daily, Weekly, Monthly, Quarterly, or Annually). Choose your Tables time period and toggle on (or off) Striped rows. Once your are done customizing your chart and click Done in the top right.
Some support articles below might be helpful
- How to add a table in your investor update
- How to share your dashboard
- How to create and bulk edit User-provided metrics
- How to connect a google sheet
See screenshots of the process below that might be helpful
Open Visible
Open the dashboard you where you want the Table to live

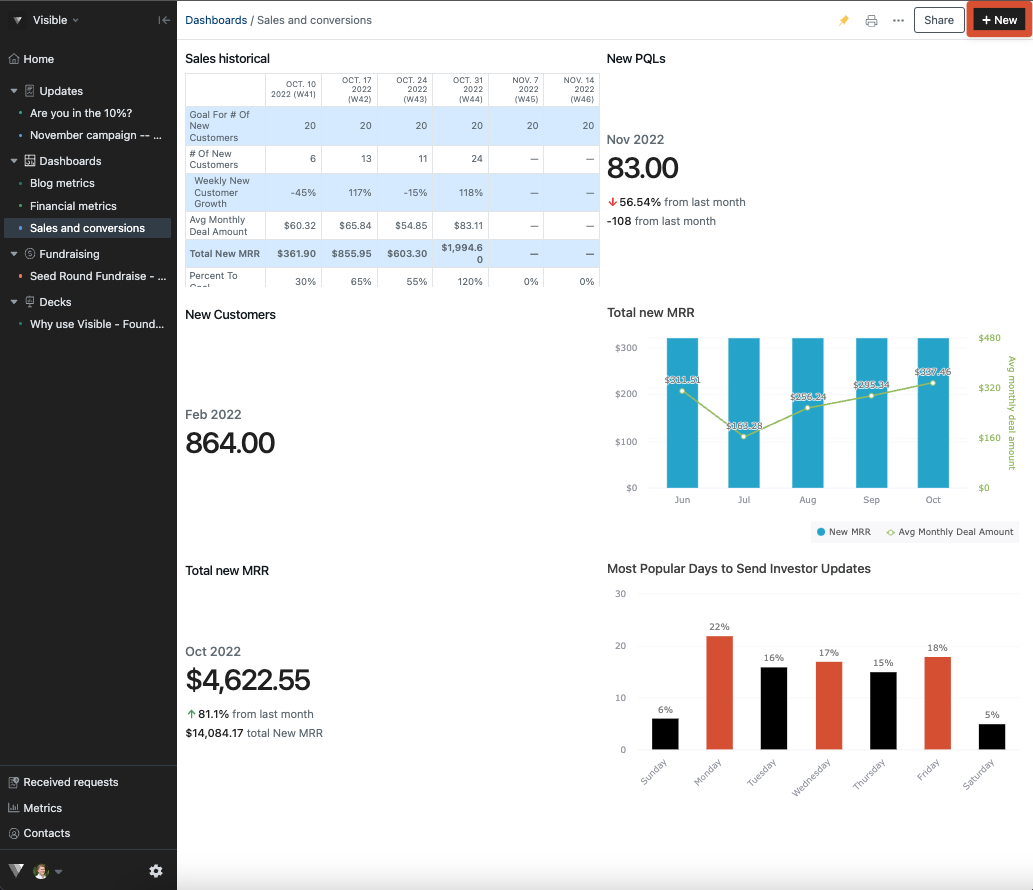
Click + New button in the top right of your screen
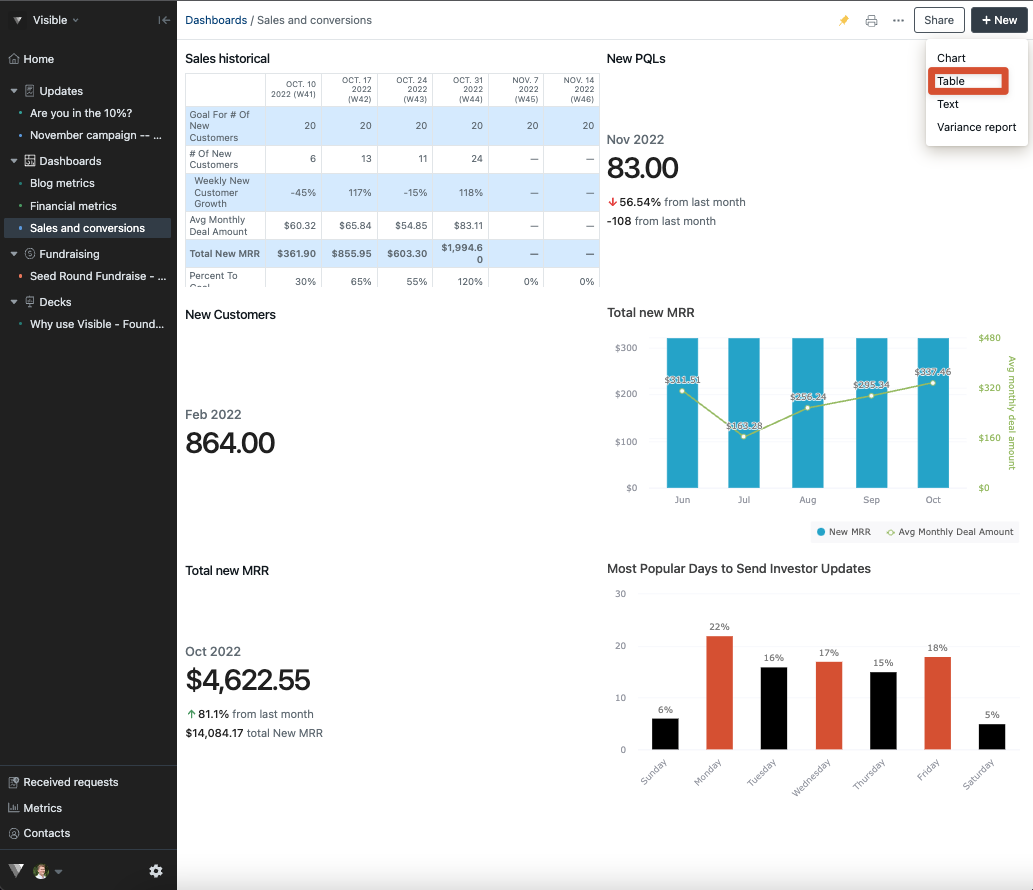
Choose Table
Write a title for your table and add metrics
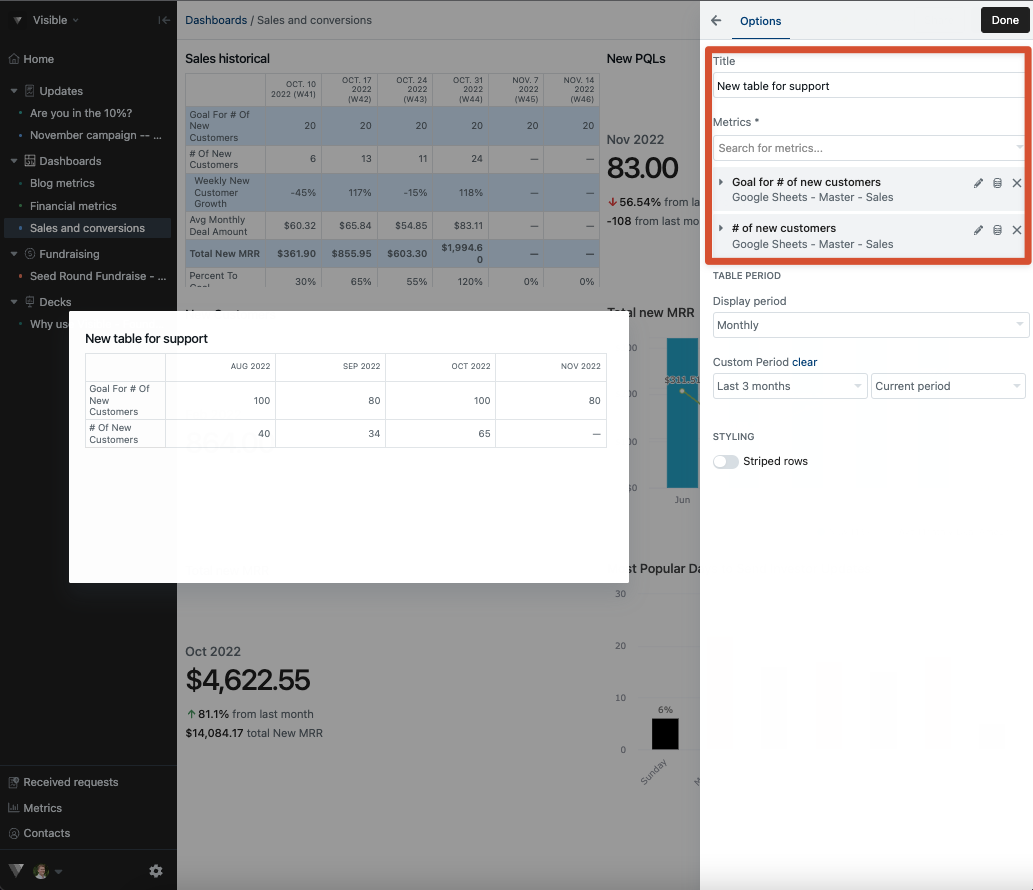
In the Table Period section, choose your display period and add any other customizations

Click Done in the top right of your table builder

Please let us know if you have additional questions!