
Formulas will help you to pull insights and manipulate your data sources. This article will show you how to display your formulas on a chart or table
To use a formula within your chart, you will first want to create a formula. Once you have a formula built based off your integrations. You can easily use the formula as a source of data for your charts and tables. Open Visible and the dashboard where your would like your chart to exist.Click + New in the top right of your dashboard and choose chart. When choosing your data source, choose Formula and the specific formula metric your would like to display. Within Options, you can choose the chart type.
It might be helpful to note that when creating your initial formula, you can use a metric insight on a single metric. This should help you with manipulating your data sources or highlighting an individual metric in a number chart.
See screenshots of this process below
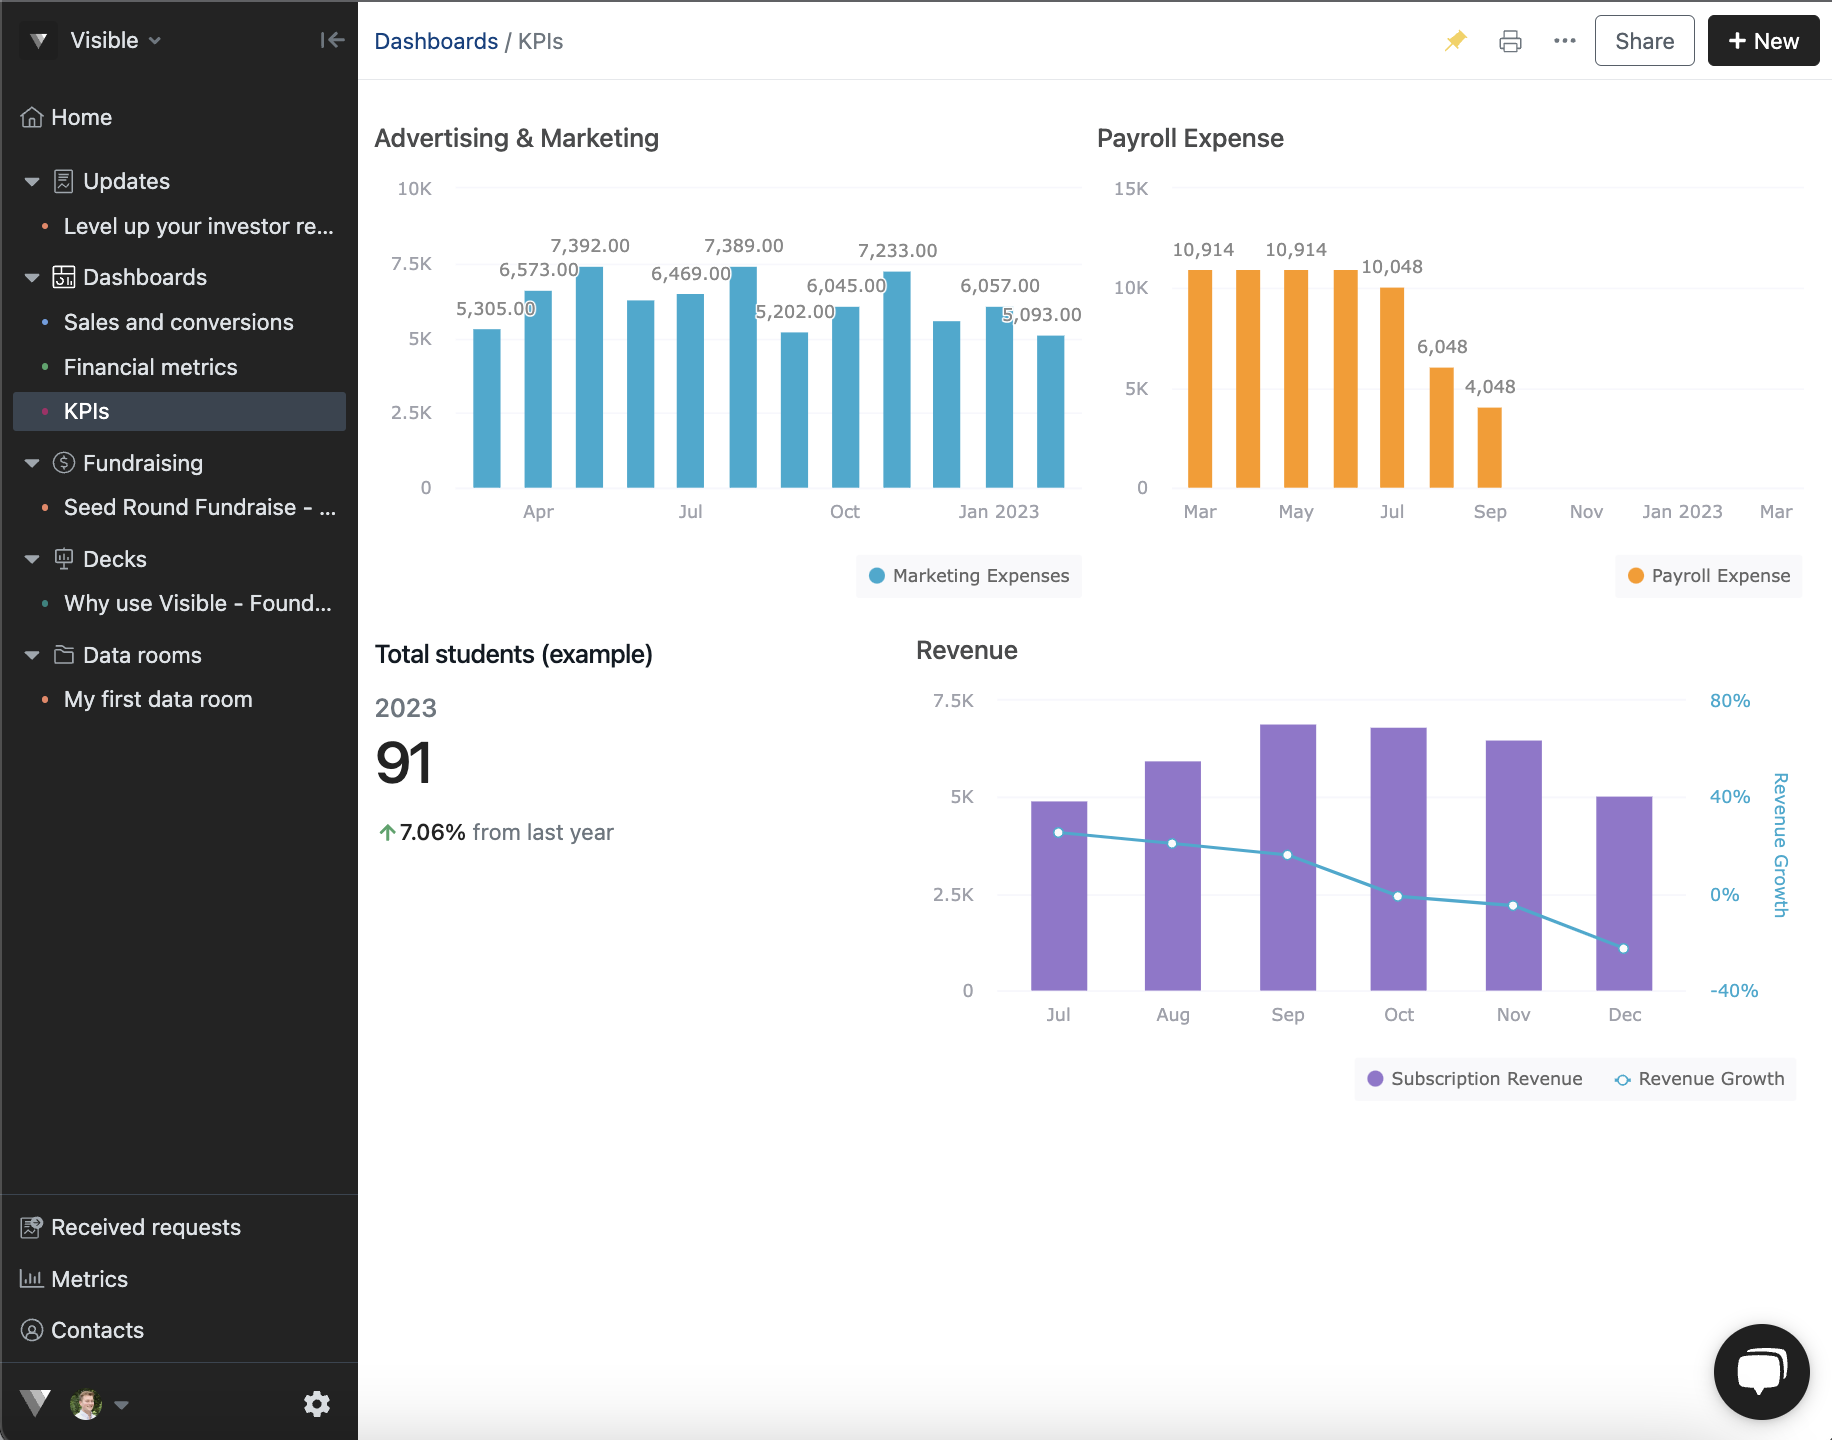
Open Visible

Open the dashboard where you would like the chart to live
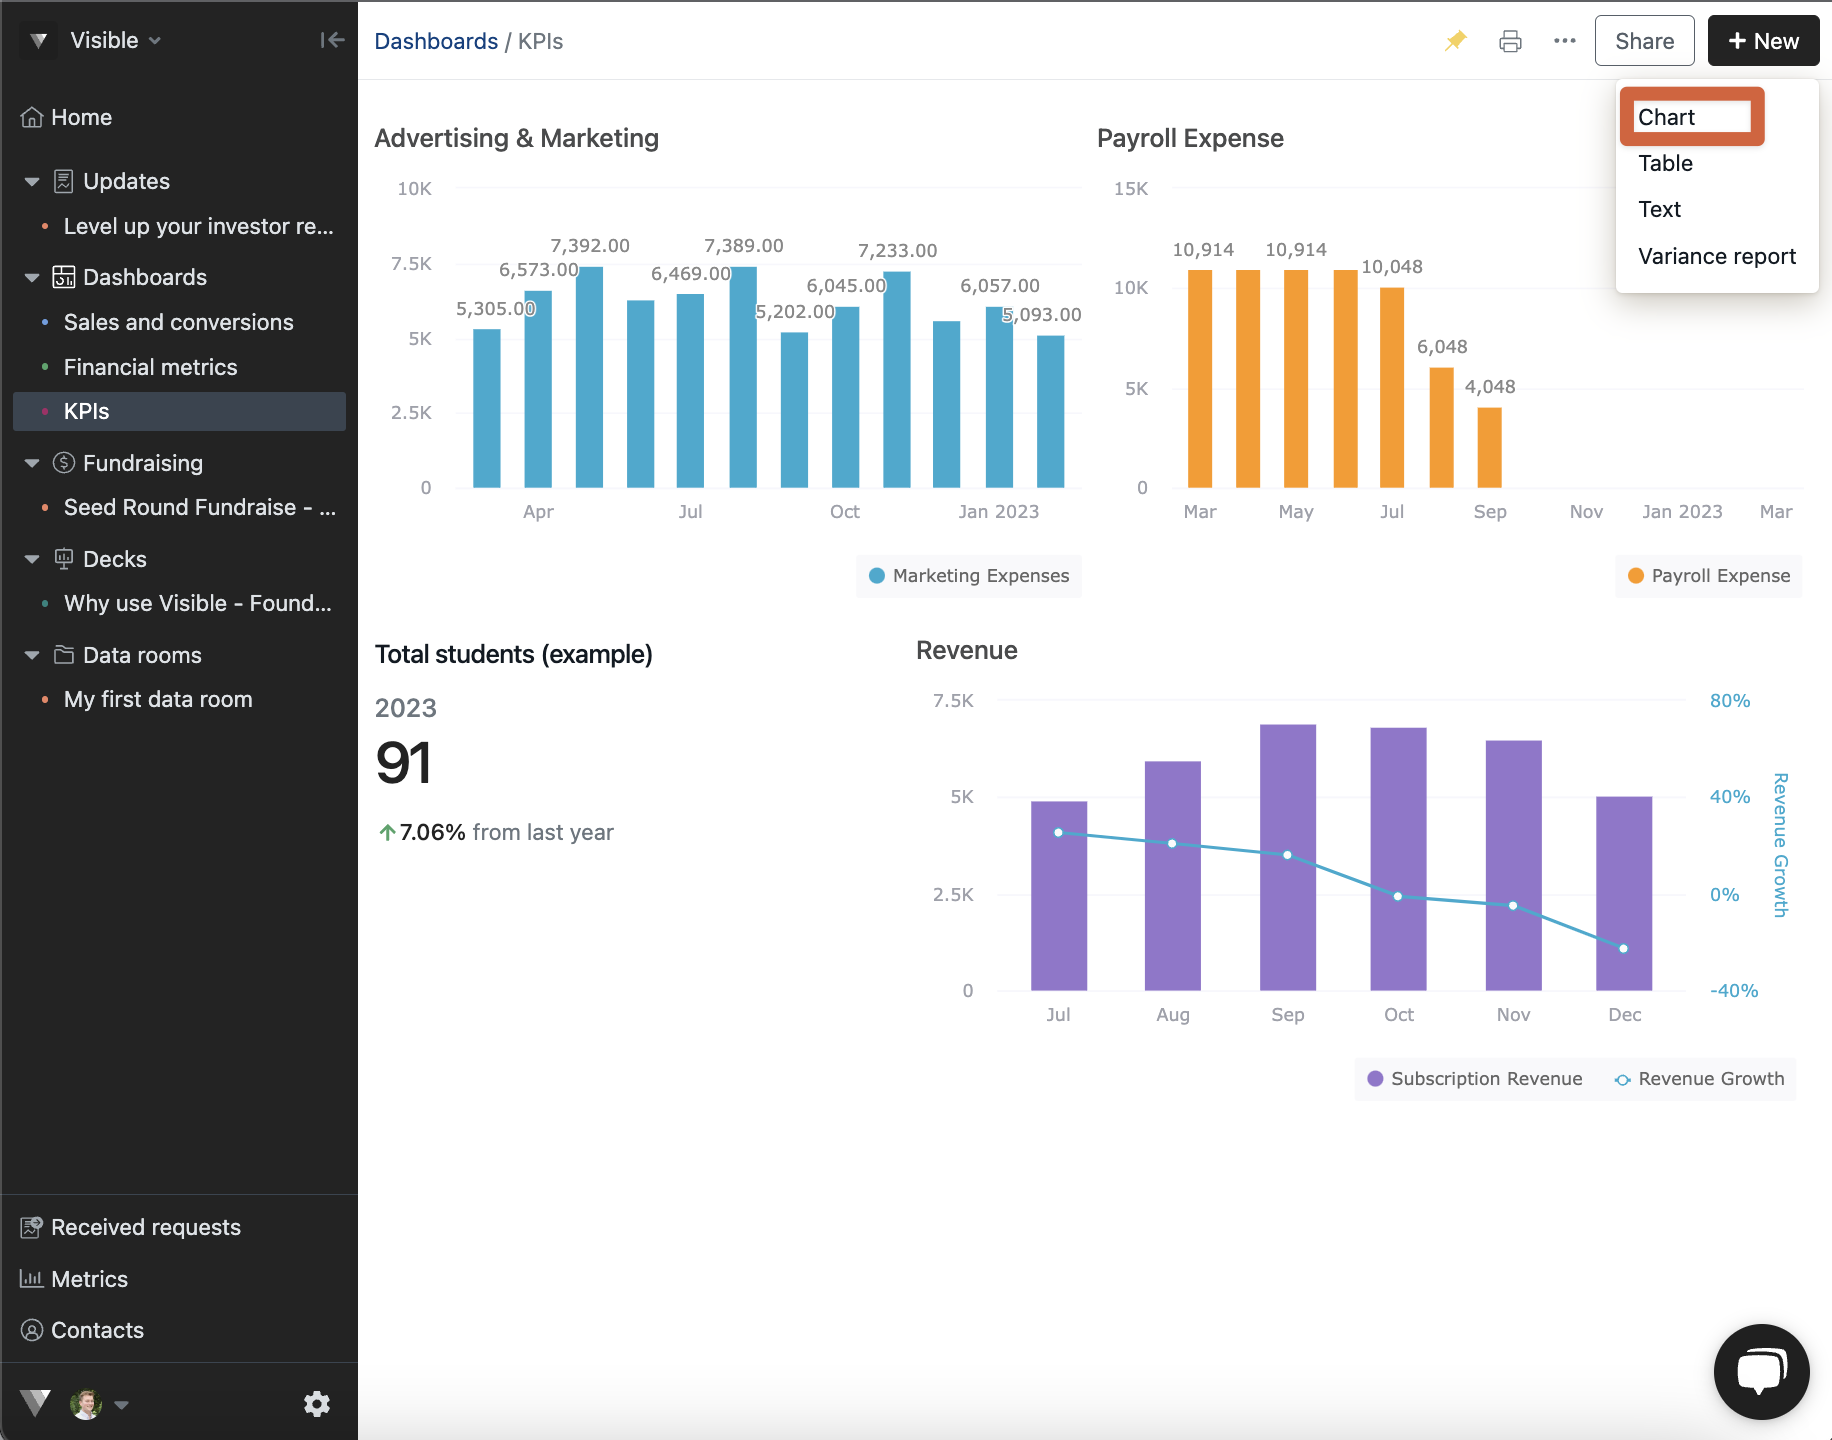
Click + New in the top right of your dashboard and choose Chart
Click where it says Search for metrics... and select Formula as the data source for your chart
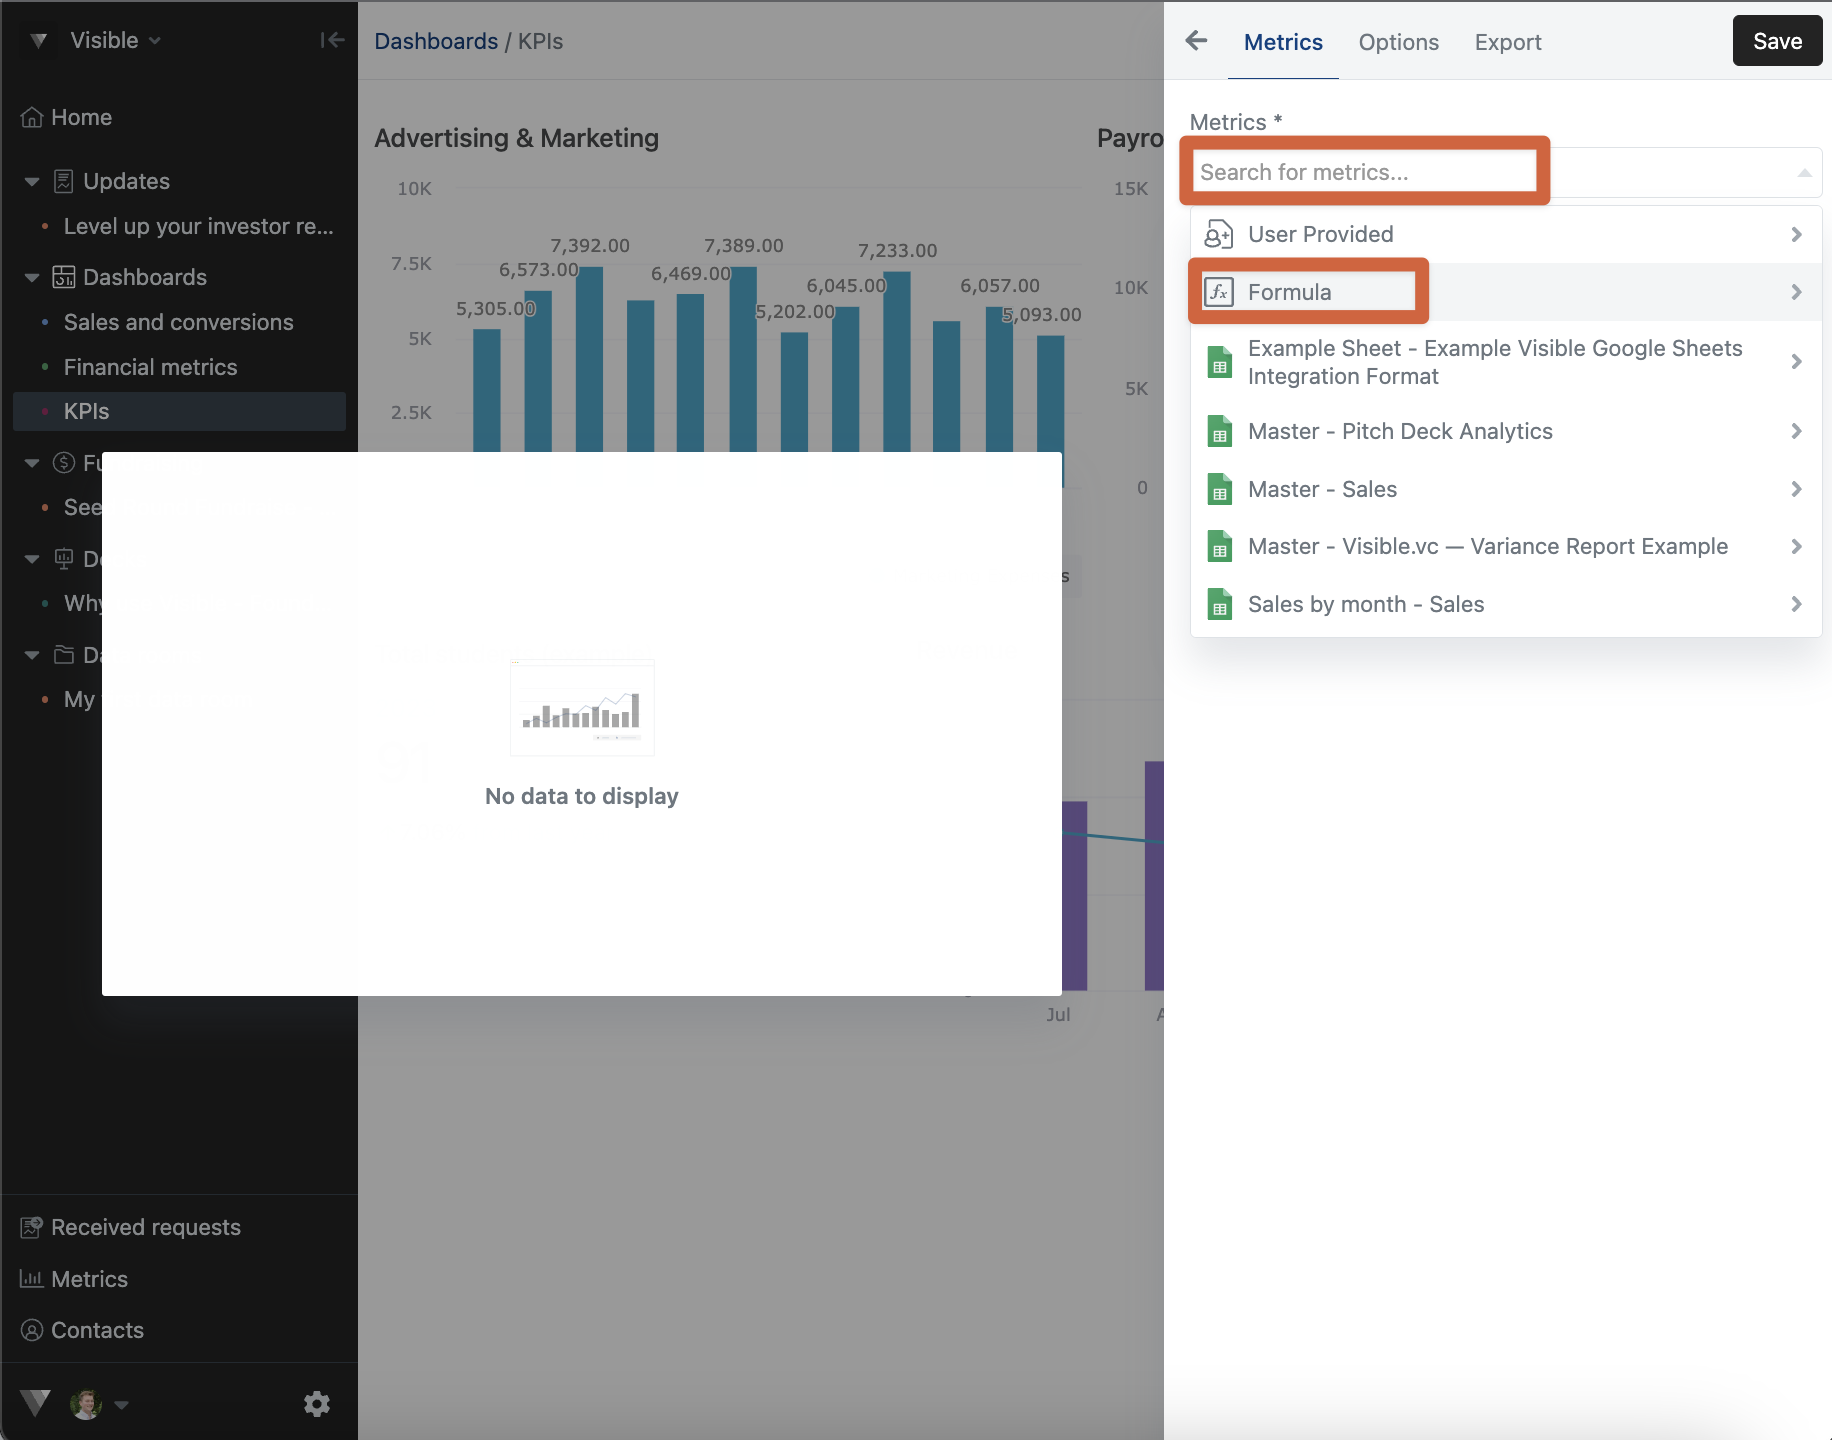
Choose the formula you wish to display
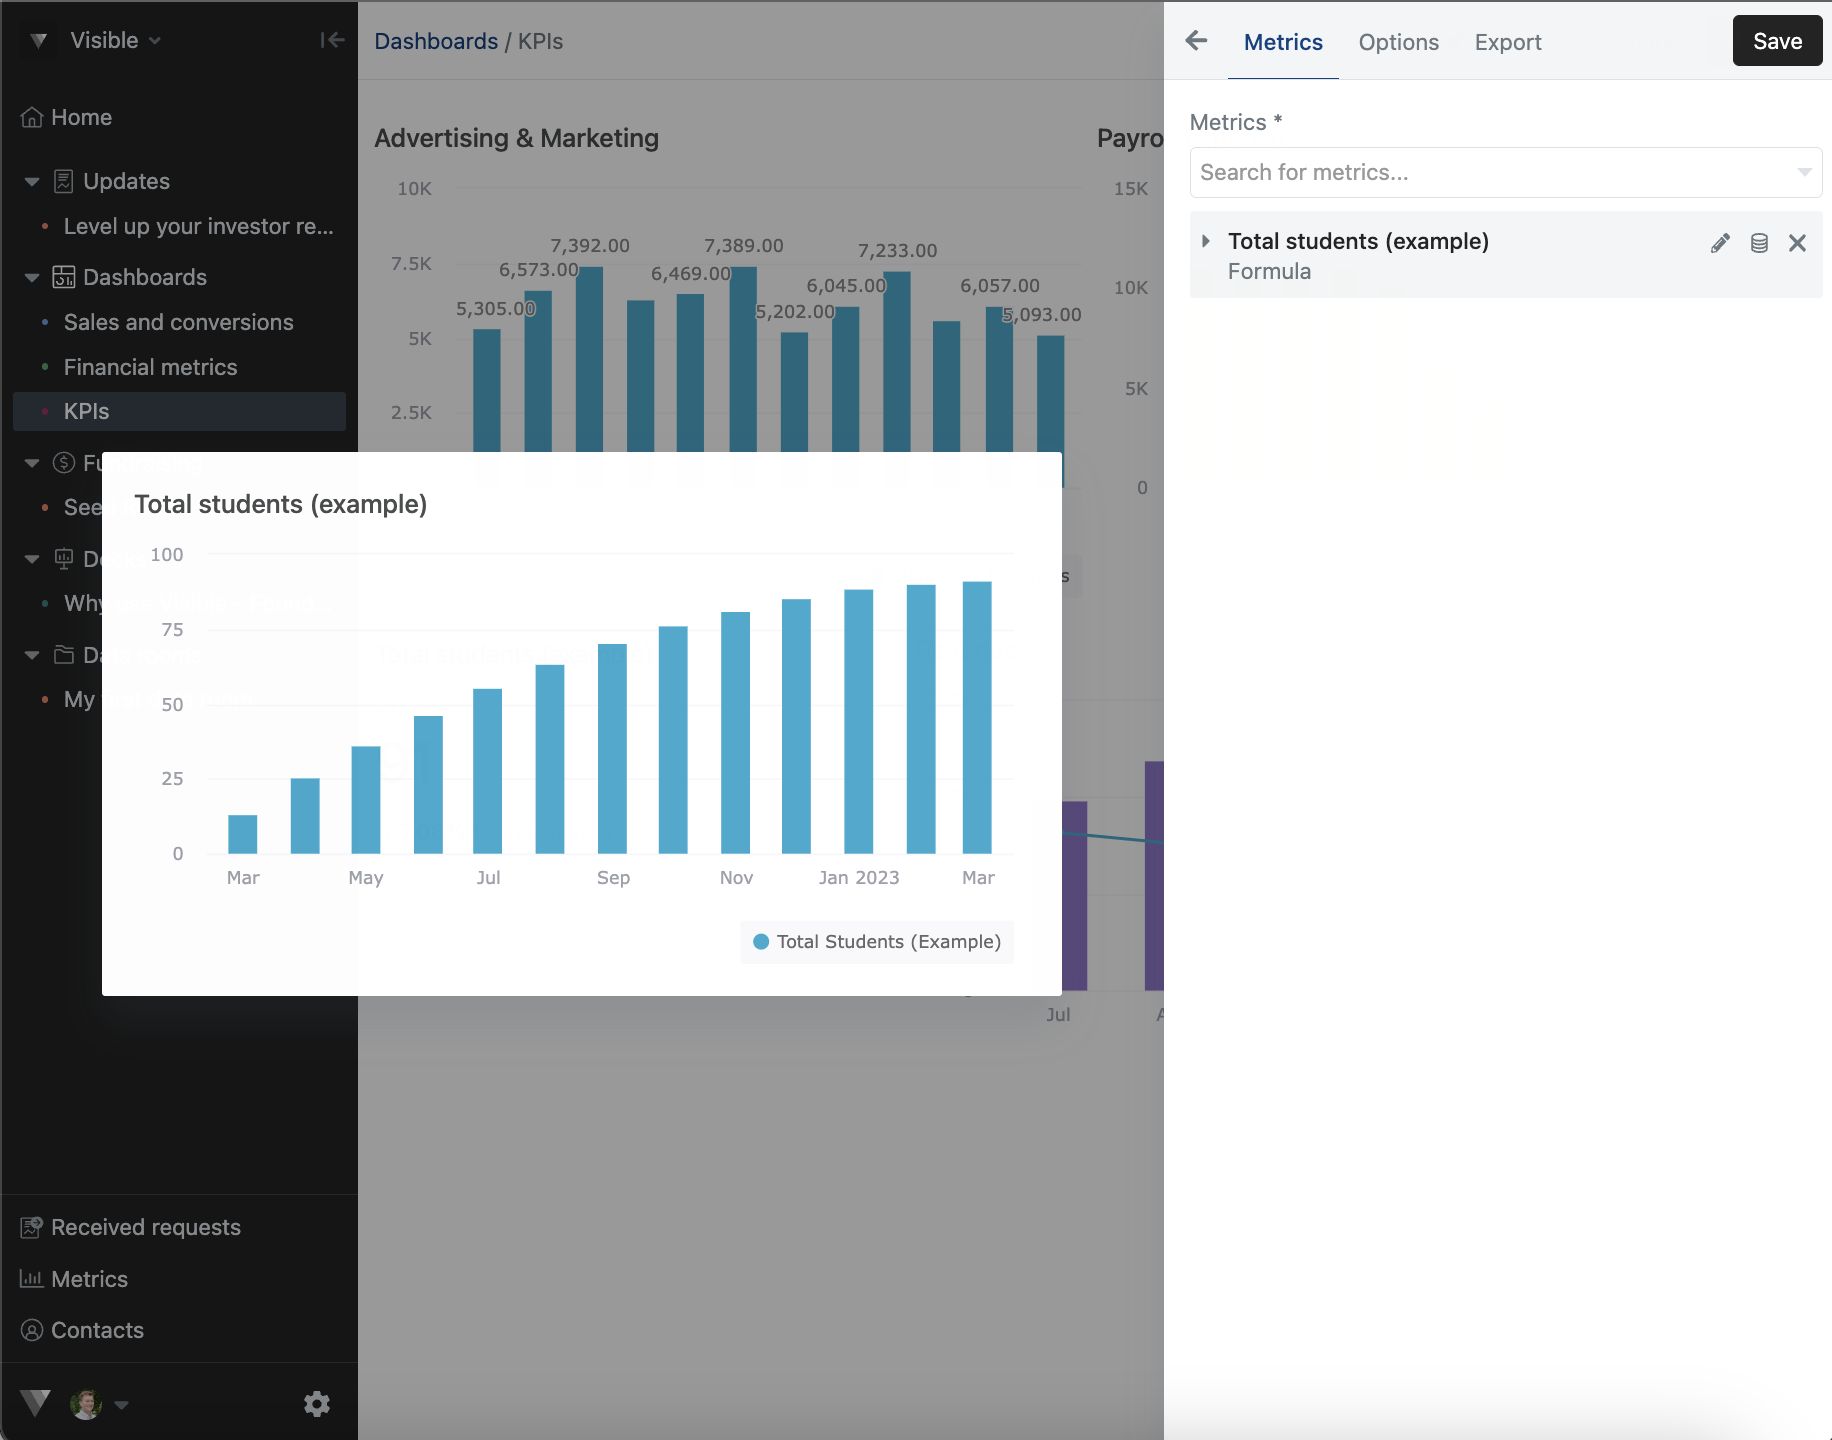
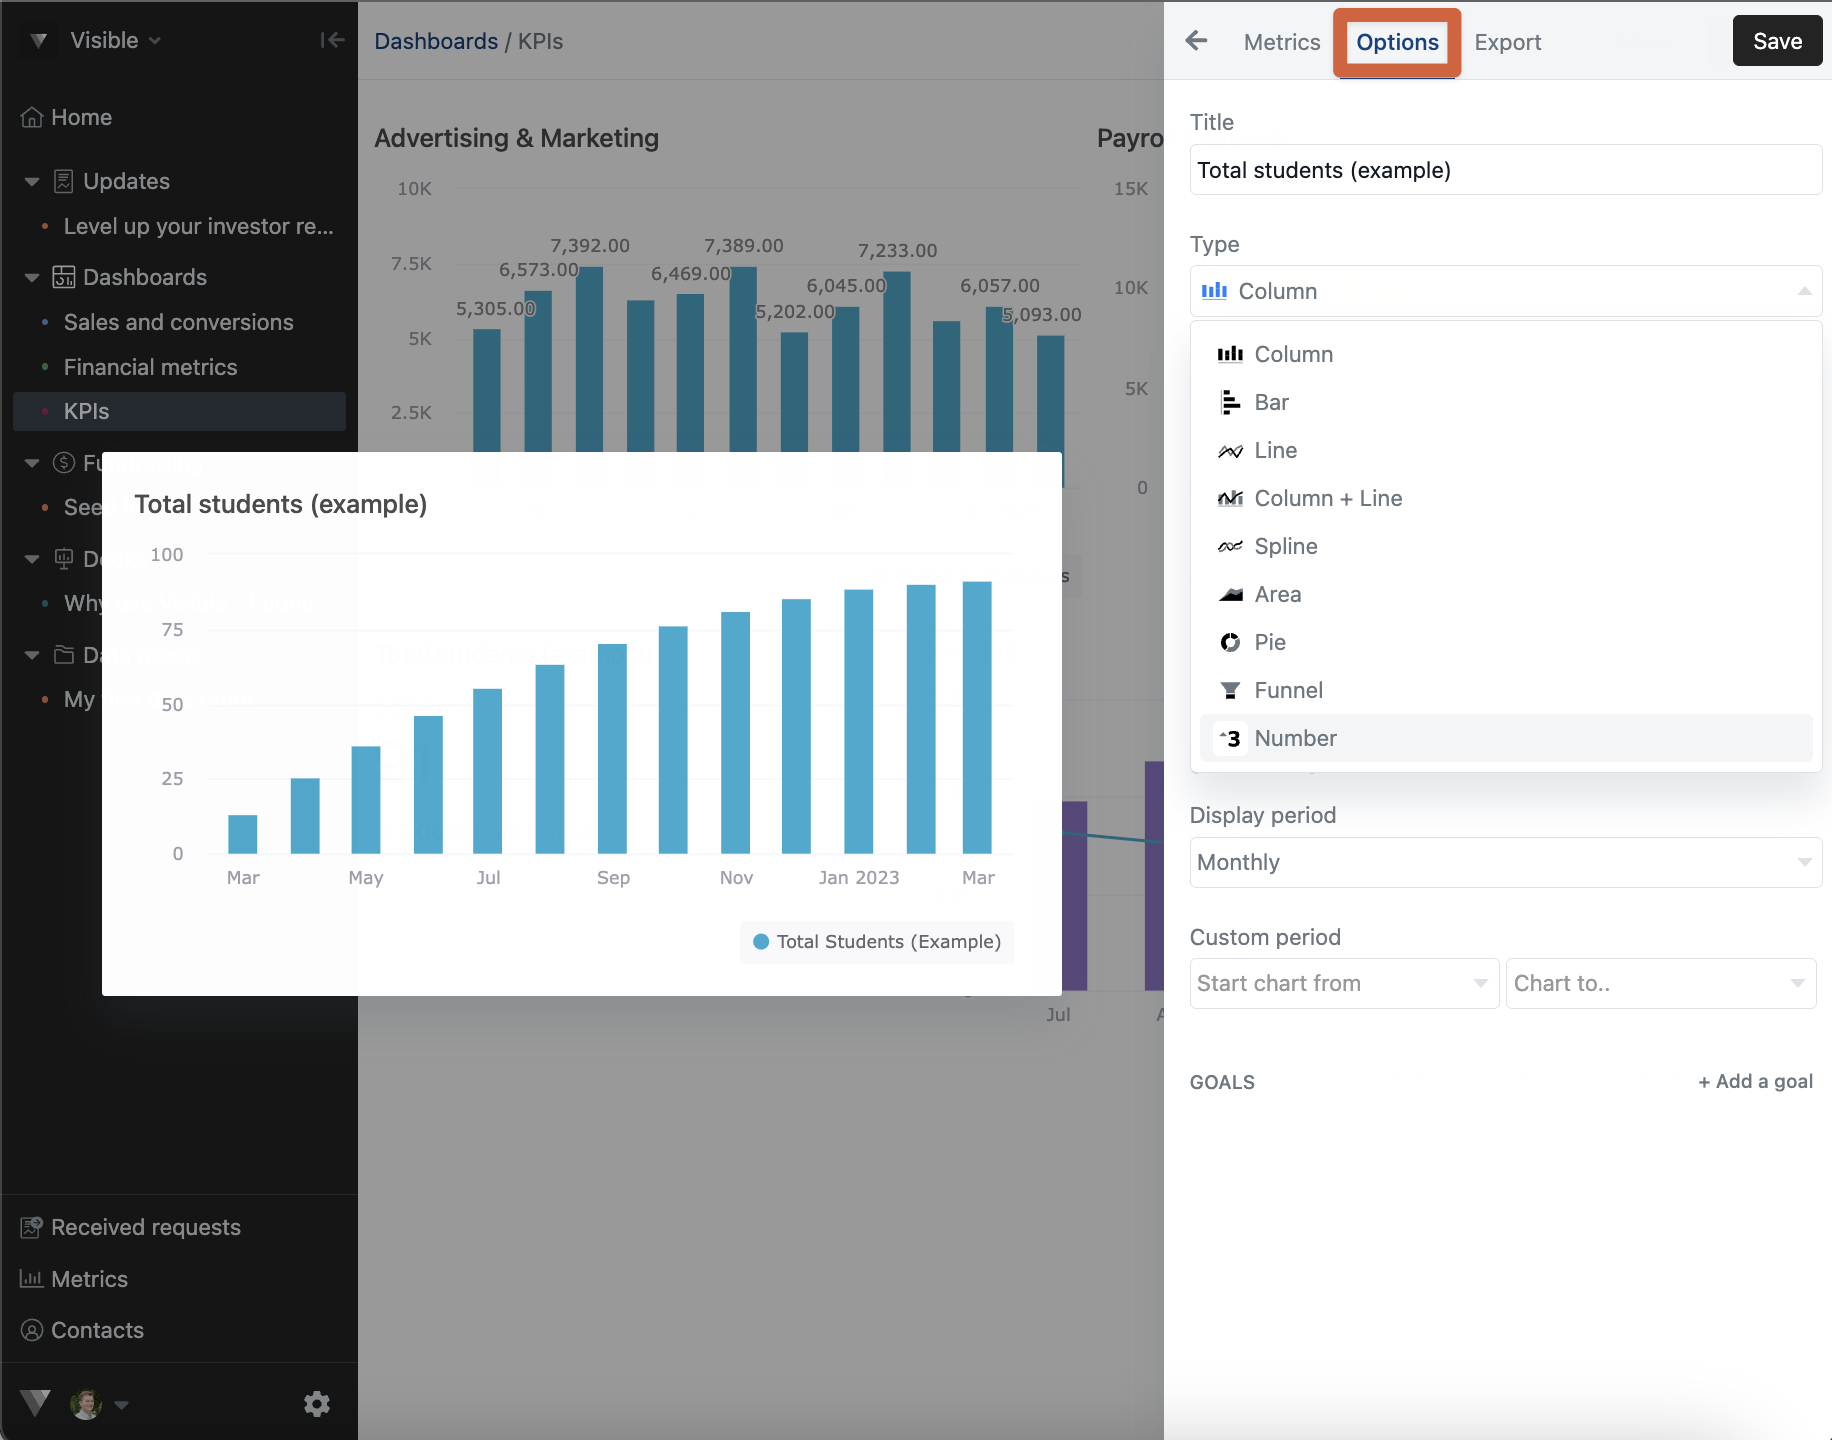
Notice the options of chart types your can use within Options
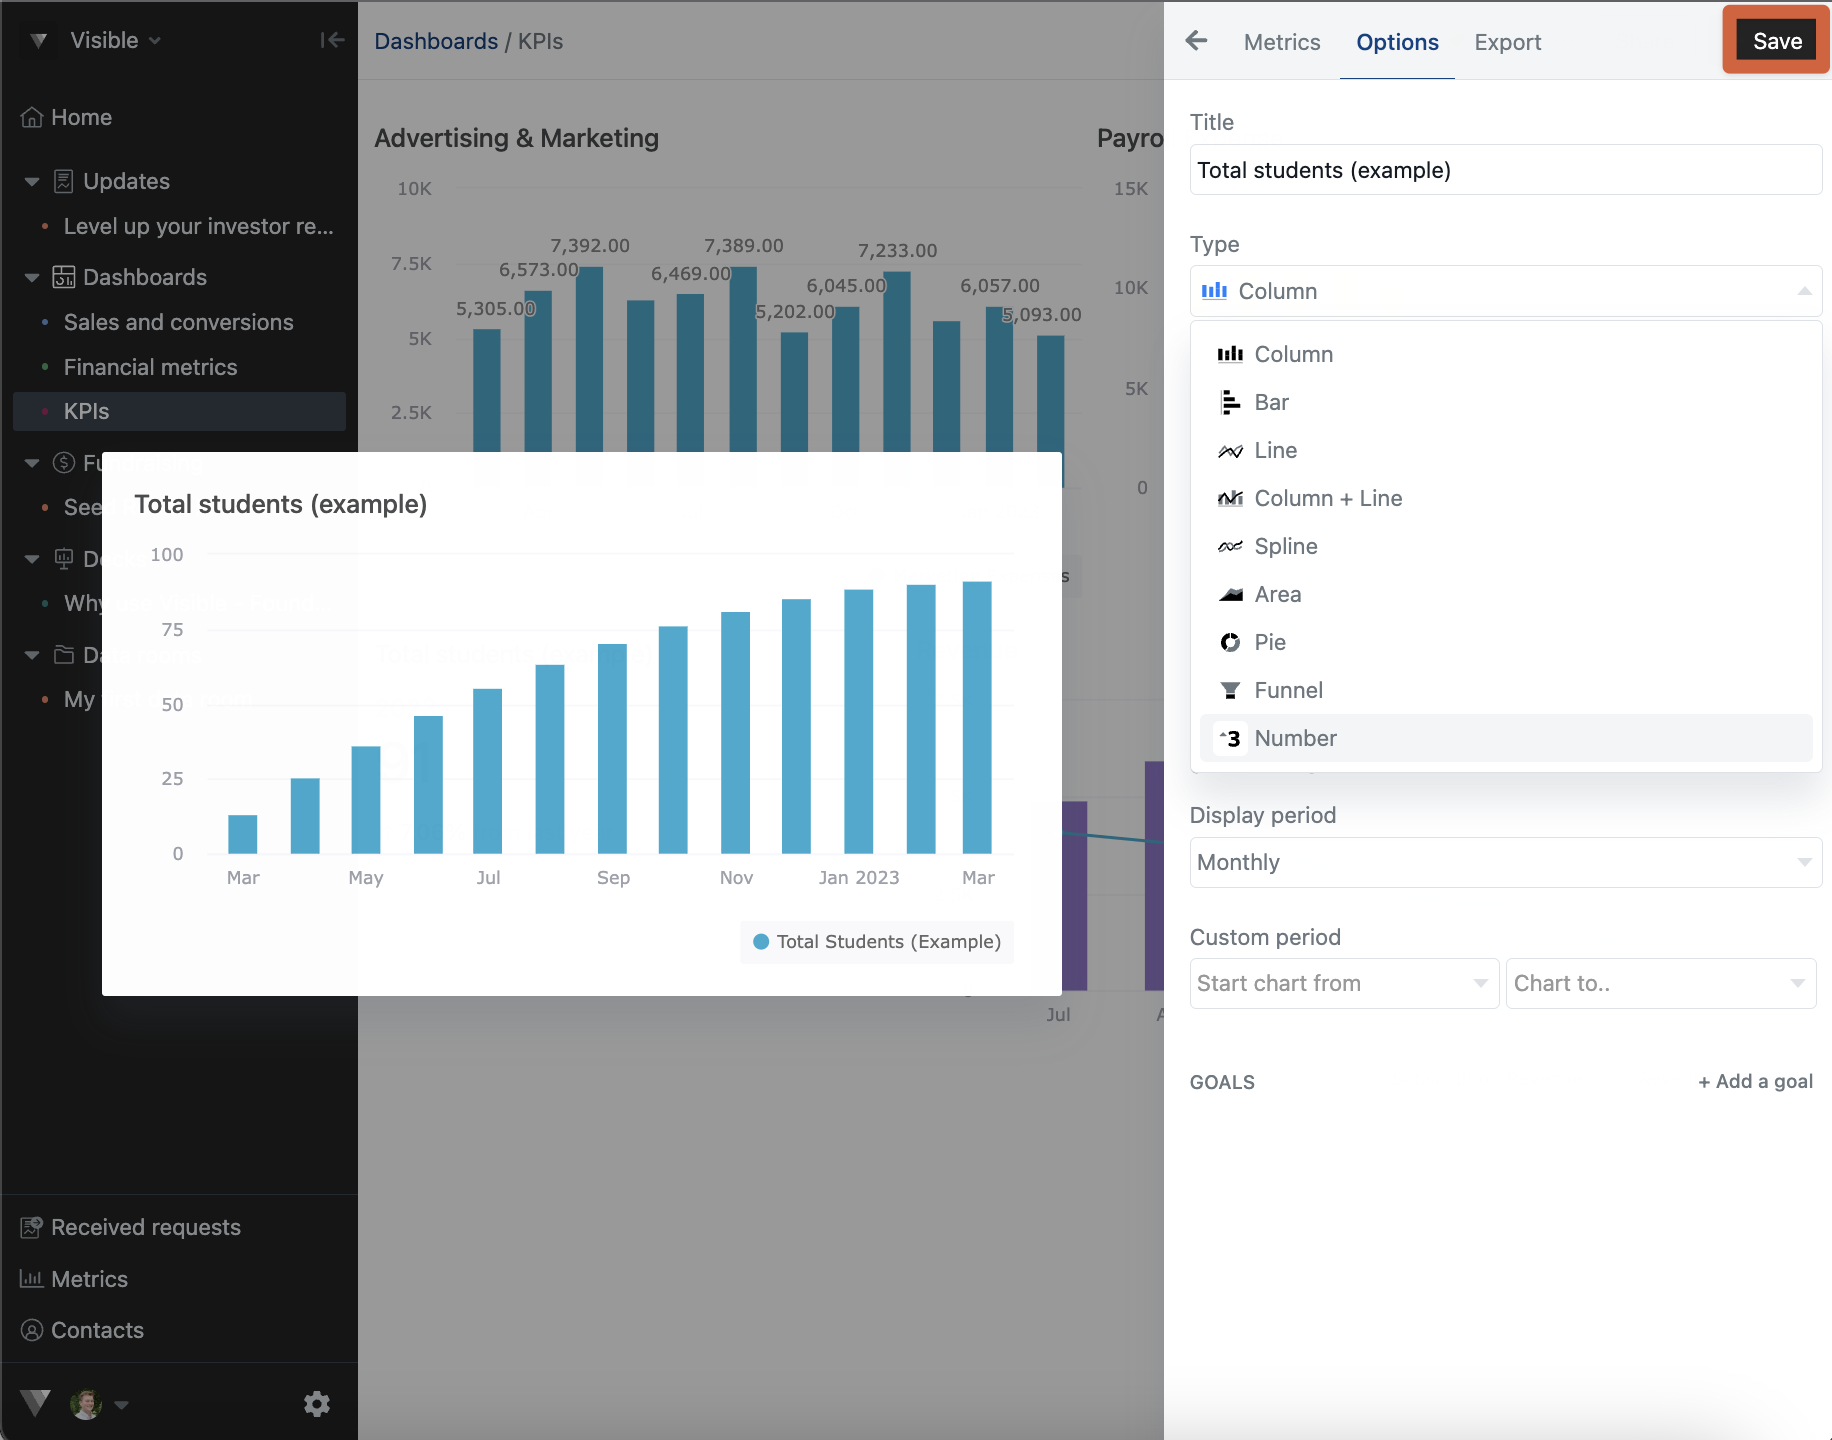
Click Save in the top right to save your progress
Formulas and chart building can be complicated. Please reach out to our team if your have any questions.