
Tips and tricks to start turning your data into beautiful charts and dashboards.
Once you have your data sources integrated within Visible, it is time to focus on sharing that data with your stakeholders. There are two primary ways to get your data out of Visible; creating and sharing dashboards and sending Updates.
In this article - we will take a look at the tips and tricks for getting started with dashboards. If you would like to learn more about getting started with Updates you can check out this article.
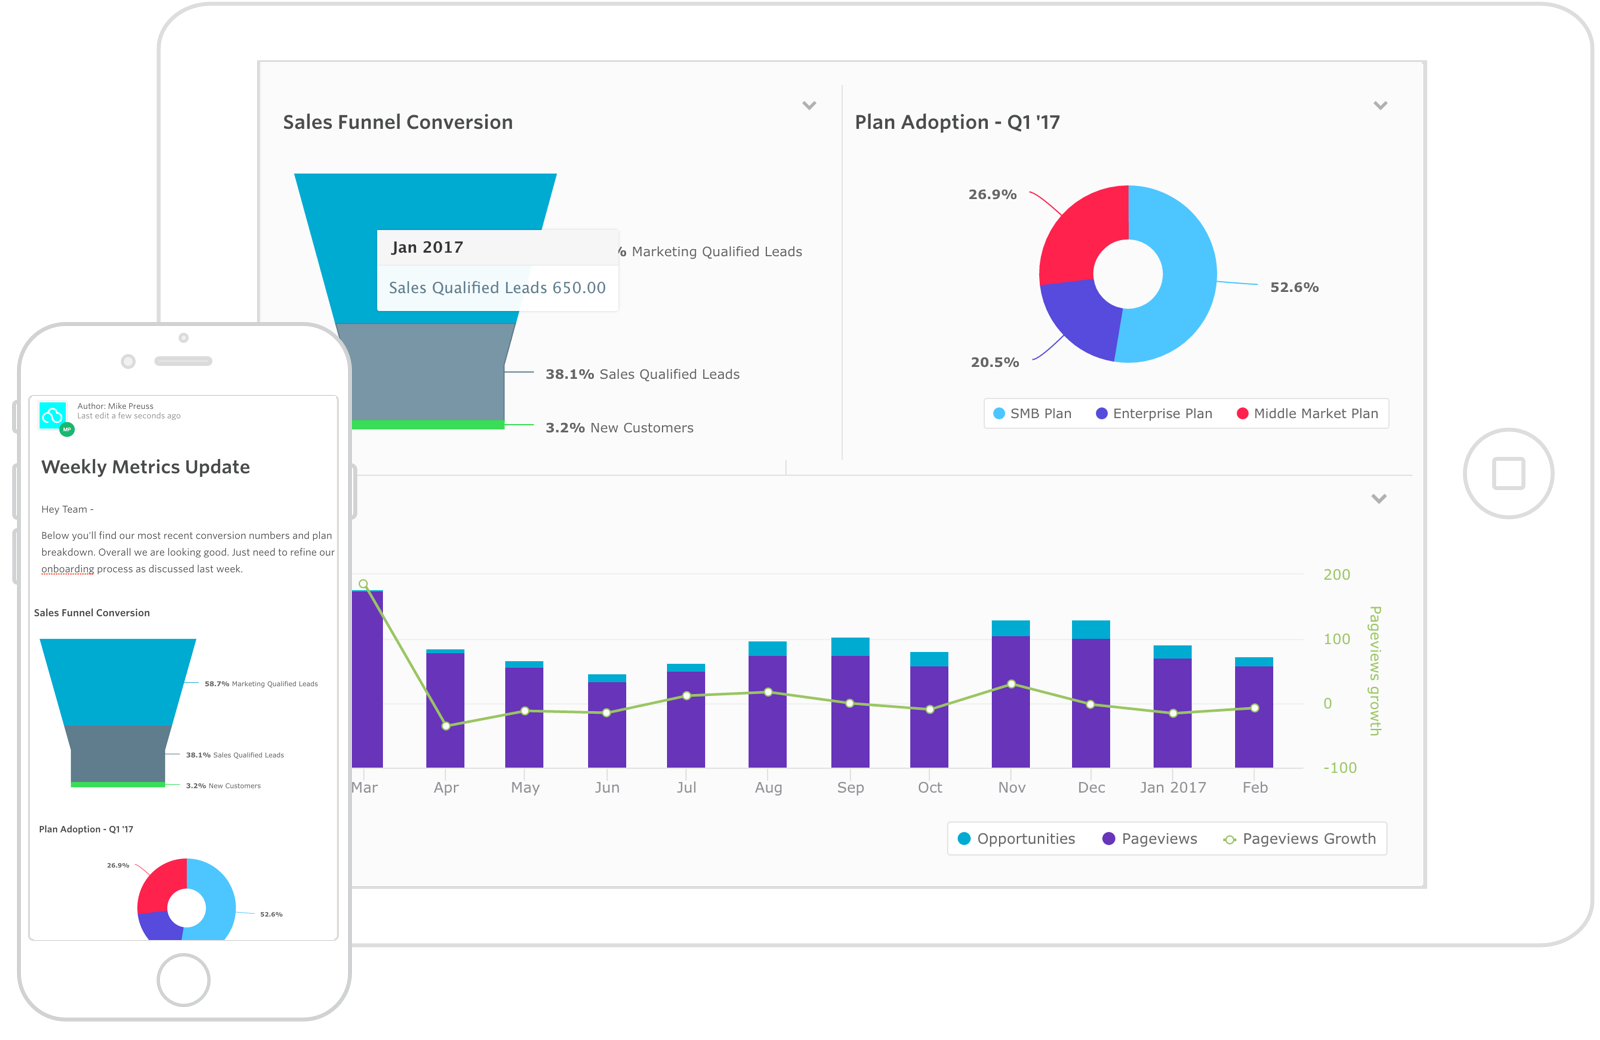
Dashboards enable you to add text, create a variance report, create a chart, or create a table. After creating a dashboard, you will be able to seamlessly add these charts and tables to your investor update. Dashboards should help you to track your core metrics.
Below are a set of articles and tips that will help you get started with dashboards:
If you have any further questions or need a hand getting your dashboards setup - feel free to write in using the messenger in the bottom right corner of this window or shoot us a message to support@visible.vc